
Working with advanced options
The advanced edit mode offers further tools for customizing your sheet, as well as alternative options for working with sheets.
If you have used previous versions of Qlik Sense, you will recognize Advanced options as the previous sheet editor. The advanced edit mode contains all the features and properties previously available when editing sheets.
Unlike standard options, the advanced edit mode offers a grid on which you can drag and drop visualizations and extensions. You can then resize the visualizations to fit the preferred number of grid squares. The advanced edit mode also supports touch-only devices, unlike standard mode.
Sheet in the advanced edit mode.

Click Advanced options to switch between standard and advanced options. This allows you to develop a hybrid approach for your sheets. If you change the layout settings in the advanced edit mode, the sheet will be locked in the standard edit mode for layout editing.
The following tasks can be done in the advanced edit mode:
-
Edit the sheet properties, such as title, description, and thumbnail.
-
Add a background color or image to a sheet.
-
Change visualization properties, such as sorting and styling.
-
Copying and pasting visualizations or visualization styling.
-
Adding multiple expressions as dimensions or measures in a visualization.
-
Add custom objects to a sheet.
-
Setting show conditions for sheets.
-
Adjust grid size and layout of a sheet.
-
Add actions to a sheet.
Some visualizations can only be added in the advanced edit mode:
-
Button
-
Text & Image
-
Container
-
Analyses
-
Custom objects, such as extensions from the Dashboard bundle or Visualization bundle.
You can perform many of the same actions in advanced edit mode as you can in the standard edit mode, although there are some differences. Some of the same actions are applied in different ways. For example, visualizations are added to sheets by dragging and dropping them onto a grid in the advanced edit mode. Some actions, like filters, can only be applied in standard mode. Some sheet properties can only be set in advanced mode.
Creating a new sheet
You can create a new sheet from the application overview or from the assets panel.
Procedere come indicato di seguito:
- From the application overview, click
 to view the sheets.
 - Click
 or Create new sheet.
 - Give your sheet a title and add a description.
- Click outside the text area to save the title and description.
A new sheet is created. Your sheets are private until you make them public. For more information, see Concessione dell'accesso a fogli, gruppi di fogli, segnalibri e racconti.
Setting sheet properties
You have a wide range of ways to style your sheet and change sheet behavior in advanced mode. For more information, see the following:
Creating visualizations
Procedere come indicato di seguito:
-
In edit mode, drag the visualization from the assets panel onto the sheet or double-click the visualization.
-
Add dimensions and measures to the visualization.
You can add dimensions and measures using the buttons on the visualization. You can also drag a field from the Fields tab of the assets panel and then select it to use it as a dimension or measure The number of dimensions and measures that are required depends on which visualization you select.
If you want to add expressions as dimensions or measures, click in the properties panel, under Data, click add and then click
 .
. -
Adjust the presentation: for example: sorting, coloring, or labeling.
For more information, see Modifica dell'aspetto di una visualizzazione.
Custom objects are added in a similar manner. You start creating a visualization by dragging a visualization extension onto the sheet. For more information, see Creazione di una visualizzazione utilizzando un oggetto personalizzato.
You can use tab containers to save space on your dashboard, by quickly switching between tabs with different visualizations. For more information, see Contenitore a schede.
The types of data you have in your tables and fields impacts whether they can be used as dimensions or measures.
- Le dimensioni determinano il metodo di raggruppamento dei dati all'interno della visualizzazione. Ad esempio: vendite totali per paese o numero di prodotti per fornitore. For more information, see Raggruppamento dati con dimensioni.
- Measures are calculations used in visualizations, typically represented on the y-axis of a bar chart or a column in a table. Le misure vengono create da un'espressione composta da funzioni di aggregazione, ad esempio Sum o Max, combinate con uno o più campi. For more information, see Misure.
Creating visualizations with analyses
Analyses allow you to build visualizations by starting with a type of analysis. You then select data for the analysis to use and then the analysis generates a chart. You can then adjust analysis-specific properties and style the visualization.
In analysis mode, analyses are identical to other visualizations.
Analyses are available from Analyses in the assets panel. For more information, see Creazione e modifica di analisi.
Creating visualizations with chart suggestions
Chart suggestions functions similarly to the autochart in the standard edit mode. You can turn on chart suggestions in the properties panel. When turned on, as you add or remove fields, the suggested visualization adjusts itself based on your changes. You can customize a suggested visualization with a focused set of properties.
For more information, see Creazione di visualizzazioni utilizzando i suggerimenti di grafici Advisor informazioni strategiche.
Moving visualizations
Procedere come indicato di seguito:
-
Click and drag visualizations to reposition them on the grid.
Copying visualizations
In advanced options, you can copy and paste visualizations in the following ways:
- Using the edit bar on the sheet (
 ,
,  , and
, and  ).
). - By right-clicking and selecting Cut, Copy and Paste.
- With the keyboard shortcuts Ctrl+C, Ctrl+X and Ctrl+V.
Depending on what situation you are in, different things will happen when you paste a copied visualization on a sheet while using advanced options:
- If a visualization is selected, then the selected visualization will be replaced.
- If no visualization is selected, then the pasted visualization will be placed in the largest empty space.
- If there is no empty space, then the largest visualization on the sheet will be split in half to make space for the pasted visualization.
For more information about copying and pasting visualizations, see Copia di una visualizzazione da una visualizzazione esistente.
Copying and pasting visualization styling
If you have applied custom styling to a visualization, you can copy its styling properties and paste them onto another visualization. For more information, see Copia e incolla degli stili di visualizzazione.
Converting visualizations
You can convert visualizations by clicking and dragging them onto another visualization.
Procedere come indicato di seguito:
-
While editing a sheet, drag a new chart from the assets panel onto the visualization that you want to convert.
Viene aperto il menu di scelta rapida.
-
Select the conversion option.
Aggiunta di un colore o un'immagine di sfondo
È possibile personalizzare lo sfondo di un foglio. È possibile selezionare un colore di sfondo specifico o un colore in base a un'espressione. È possibile impostare come sfondo qualsiasi immagine nella libreria multimediale. L'immagine può essere posizionata e ridimensionata, in modo che non riempia tutto lo sfondo.
Sono supportati i seguenti formati: .png, .jpg, .jpeg e .gif. Se si usa un immagine in formato .gif, questa può essere animata o statica.
Qlik Cloud Government non supporta le immagini di sfondo o i colori nei fogli.
Procedere come indicato di seguito:
- Aprire il foglio in Modalità di modifica.
- in Proprietà foglio, fare clic su Stile.
- Impostare Sfondo su Personalizzato. Il valore predefinito è Automatico.
-
Colore sfondo:
-
Colore unico: scegliere un colore utilizzando lo strumento di selezione del colore.
-
Per espressione: impostare un colore utilizzando un'espressione definita dall'utente. Per ulteriori informazioni, vedere Colorazione in base a un'espressione.
-
- Immagine di sfondo: selezionare Immagine da libreria multimediale. Il valore predefinito è Nessuna.
-
Fare clic su
 nell'anteprima predefinita.
Si apre la libreria multimediale.
-
Selezionare l’immagine che si desidera utilizzare e fare clic su Inserisci.
Se l'immagine desiderata non è già presente nella libreria multimediale, fare clic su Nuovo caricamento e aggiungere l'immagine.
- Usare il menu a comparsa per modificare le dimensioni dell'immagine
- Dimensione originale
- Adatta sempre
- Adatta alla larghezza
- Adatta all'altezza
- Adatta estendendo l'immagine
- Riempi sempre
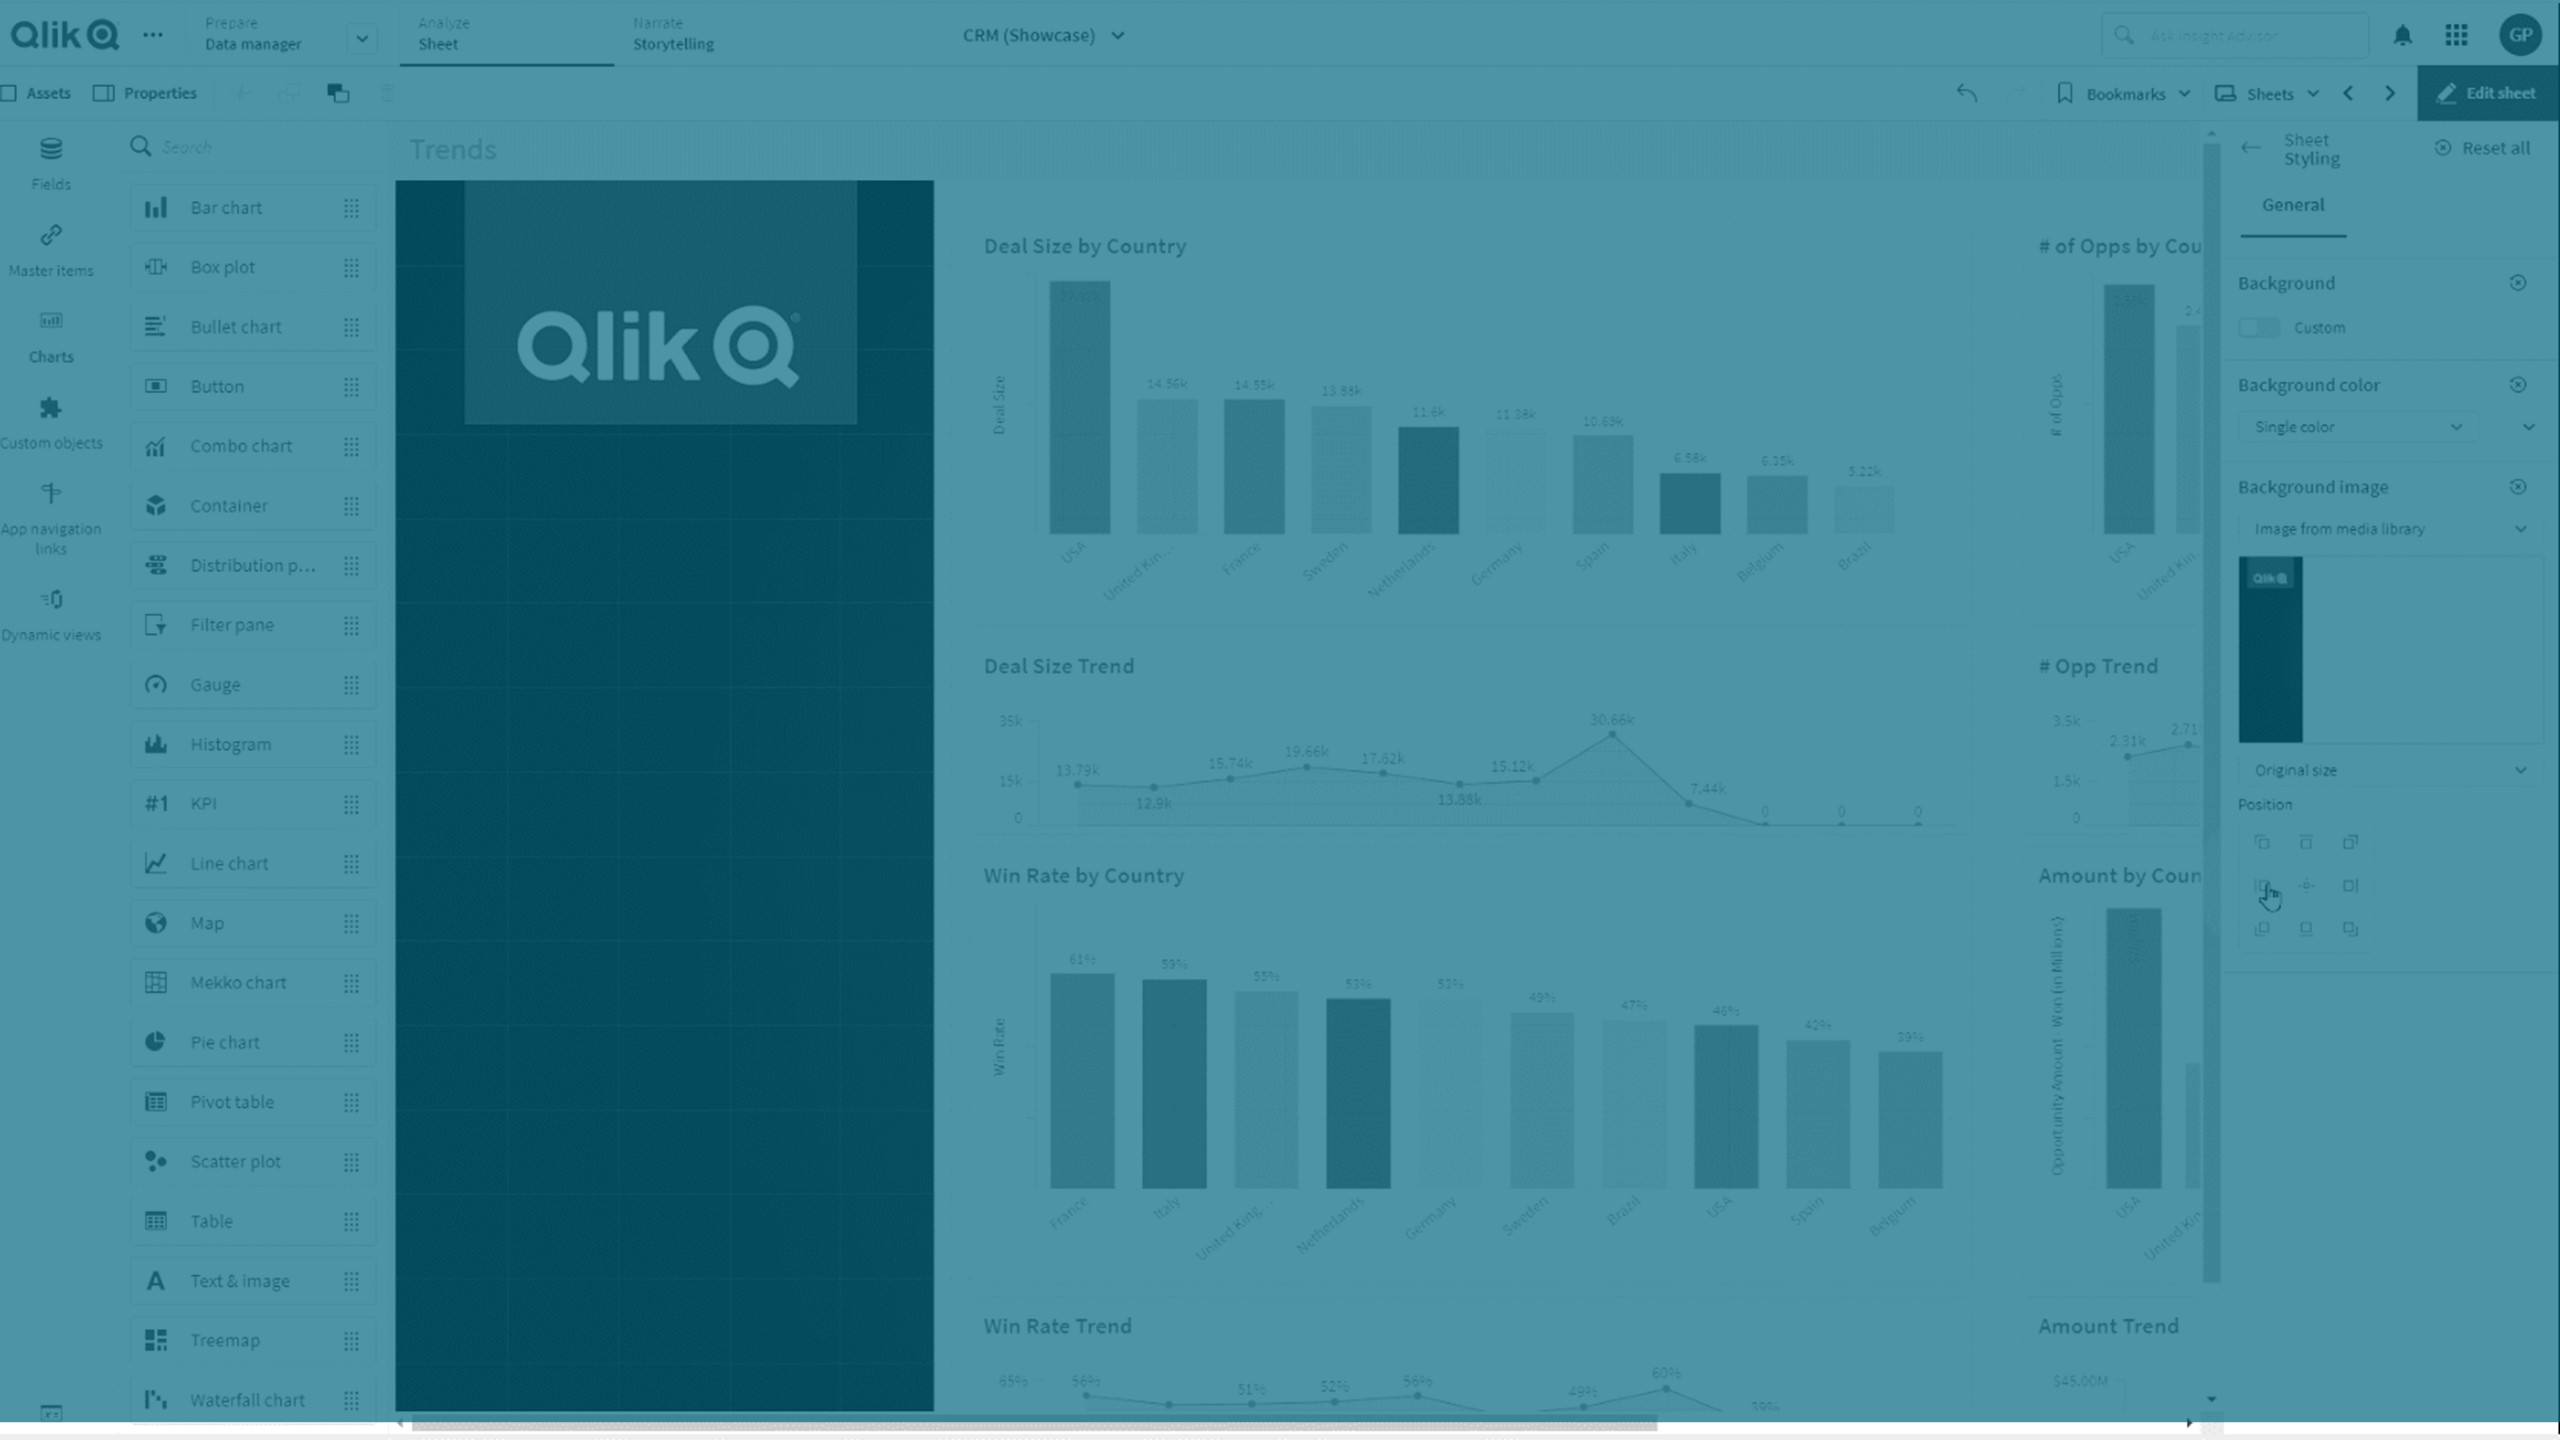
- In Posizione, è possibile modificare l'allineamento dell'immagine. Per esempio, l'immagine può essere centrata nel foglio o posizionata nell'angolo superiore destro.
L'immagine e il colore di sfondo selezionati ora sono visibili sul foglio.
Foglio nella modalità Modifica, con un'immagine di sfondo impostata a sinistra
