
Working with advanced options
The advanced edit mode offers further tools for customizing your sheet, as well as alternative options for working with sheets.
If you have used previous versions of Qlik Sense, you will recognize Advanced options as the previous sheet editor. The advanced edit mode contains all the features and properties previously available when editing sheets.
Unlike standard options, the advanced edit mode offers a grid on which you can drag and drop visualizations and extensions. You can then resize the visualizations to fit the preferred number of grid squares. The advanced edit mode also supports touch-only devices, unlike standard mode.
Sheet in the advanced edit mode.

Click Advanced options to switch between standard and advanced options. This allows you to develop a hybrid approach for your sheets. If you change the layout settings in the advanced edit mode, the sheet will be locked in the standard edit mode for layout editing.
The following tasks can be done in the advanced edit mode:
-
Edit the sheet properties, such as title, description, and thumbnail.
-
Add a background color or image to a sheet.
-
Change visualization properties, such as sorting and styling.
-
Copying and pasting visualizations or visualization styling.
-
Adding multiple expressions as dimensions or measures in a visualization.
-
Add custom objects to a sheet.
-
Setting show conditions for sheets.
-
Adjust grid size and layout of a sheet.
-
Add actions to a sheet.
Some visualizations can only be added in the advanced edit mode:
-
Button
-
Text & Image
-
Container
-
Analyses
-
Custom objects, such as extensions from the Dashboard bundle or Visualization bundle.
You can perform many of the same actions in advanced edit mode as you can in the standard edit mode, although there are some differences. Some of the same actions are applied in different ways. For example, visualizations are added to sheets by dragging and dropping them onto a grid in the advanced edit mode. Some actions, like filters, can only be applied in standard mode. Some sheet properties can only be set in advanced mode.
Creating a new sheet
You can create a new sheet from the application overview or from the assets panel.
Doe het volgende:
- From the application overview, click
 to view the sheets.
 - Click
 or Create new sheet.
 - Give your sheet a title and add a description.
- Click outside the text area to save the title and description.
A new sheet is created. Your sheets are private until you make them public. For more information, see Toegang verlenen tot werkbladen, werkbladgroepen, bladwijzers en presentaties.
Setting sheet properties
You have a wide range of ways to style your sheet and change sheet behavior in advanced mode. For more information, see the following:
Creating visualizations
Doe het volgende:
-
In edit mode, drag the visualization from the assets panel onto the sheet or double-click the visualization.
-
Add dimensions and measures to the visualization.
You can add dimensions and measures using the buttons on the visualization. You can also drag a field from the Fields tab of the assets panel and then select it to use it as a dimension or measure The number of dimensions and measures that are required depends on which visualization you select.
If you want to add expressions as dimensions or measures, click in the properties panel, under Data, click add and then click
 .
. -
Adjust the presentation: for example: sorting, coloring, or labeling.
For more information, see Het uiterlijk van een visualisatie wijzigen.
Custom objects are added in a similar manner. You start creating a visualization by dragging a visualization extension onto the sheet. For more information, see Een visualisatie maken met behulp van een aangepast object.
You can use tab containers to save space on your dashboard, by quickly switching between tabs with different visualizations. For more information, see Tabbladcontainer.
The types of data you have in your tables and fields impacts whether they can be used as dimensions or measures.
- Dimensies bepalen hoe de gegevens in een visualisatie worden gegroepeerd. Bijvoorbeeld: totale verkoop per land of aantal producten per leverancier. For more information, see Gegevens groeperen met dimensies.
- Measures are calculations used in visualizations, typically represented on the y-axis of a bar chart or a column in a table. Metingen worden gemaakt op basis van een uitdrukking die bestaat uit aggregatiefuncties, zoals Sum of Max, gecombineerd met een of meerdere velden. For more information, see Metingen.
Creating visualizations with analyses
Analyses allow you to build visualizations by starting with a type of analysis. You then select data for the analysis to use and then the analysis generates a chart. You can then adjust analysis-specific properties and style the visualization.
In analysis mode, analyses are identical to other visualizations.
Analyses are available from Analyses in the assets panel. For more information, see Analyses maken en bewerken.
Creating visualizations with chart suggestions
Chart suggestions functions similarly to the autochart in the standard edit mode. You can turn on chart suggestions in the properties panel. When turned on, as you add or remove fields, the suggested visualization adjusts itself based on your changes. You can customize a suggested visualization with a focused set of properties.
For more information, see Visualisaties maken met diagramsuggesties van Inzichtenadviseur.
Moving visualizations
Doe het volgende:
-
Click and drag visualizations to reposition them on the grid.
Copying visualizations
In advanced options, you can copy and paste visualizations in the following ways:
- Using the edit bar on the sheet (
 ,
,  , and
, and  ).
). - By right-clicking and selecting Cut, Copy and Paste.
- With the keyboard shortcuts Ctrl+C, Ctrl+X and Ctrl+V.
Depending on what situation you are in, different things will happen when you paste a copied visualization on a sheet while using advanced options:
- If a visualization is selected, then the selected visualization will be replaced.
- If no visualization is selected, then the pasted visualization will be placed in the largest empty space.
- If there is no empty space, then the largest visualization on the sheet will be split in half to make space for the pasted visualization.
For more information about copying and pasting visualizations, see Visualisaties kopiëren uit bestaande visualisaties.
Copying and pasting visualization styling
If you have applied custom styling to a visualization, you can copy its styling properties and paste them onto another visualization. For more information, see Visualisatievormgeving kopiëren en plakken.
Converting visualizations
You can convert visualizations by clicking and dragging them onto another visualization.
Doe het volgende:
-
While editing a sheet, drag a new chart from the assets panel onto the visualization that you want to convert.
Het snelmenu wordt geopend.
-
Select the conversion option.
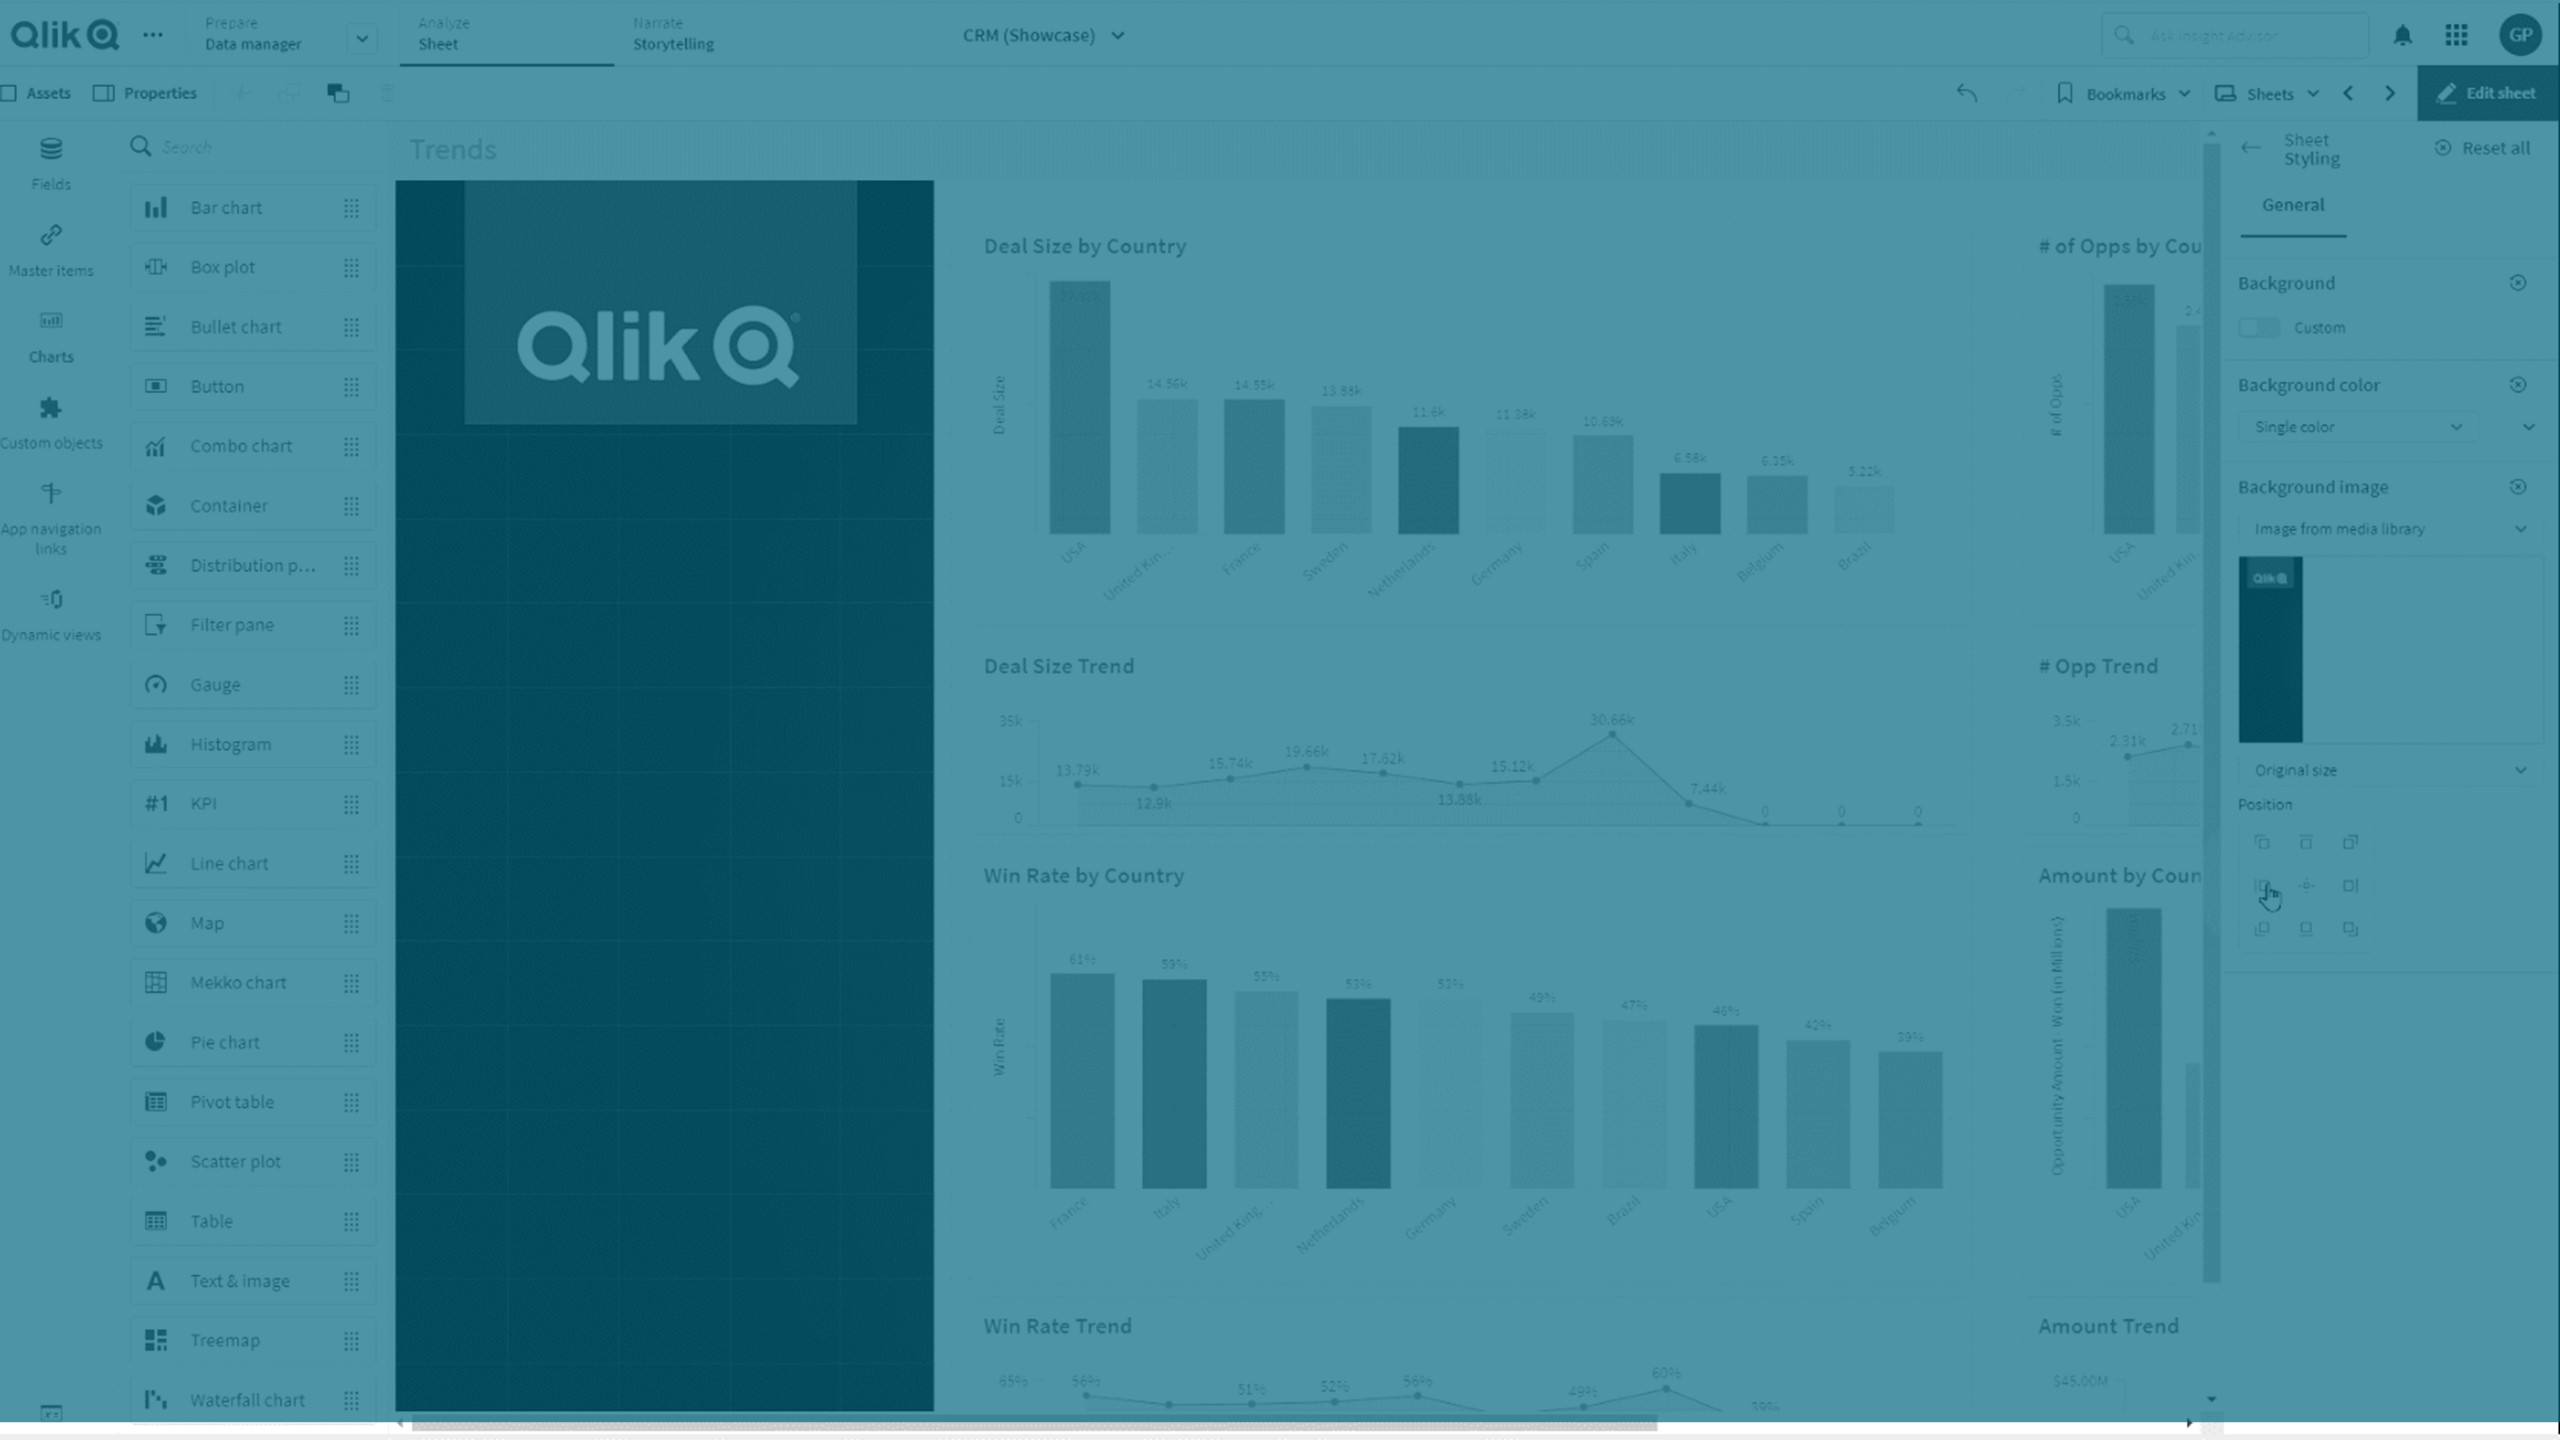
Een achtergrondkleur of afbeelding toevoegen
U kunt de achtergrond van een werkblad aanpassen. U kunt een specifieke achtergrondkleur of kleuruitdrukking kiezen. Een afbeelding in de mediabibliotheek kan als achtergrond worden ingesteld. De afbeelding kan worden geplaatst en de grootte kan worden aangepast zodat deze niet de gehele achtergrond vult.
De volgende indelingen worden ondersteund: .png, .jpg, .jpeg en .gif. Als u een gif-bestand gebruikt, kan deze geanimeerd of statisch zijn.
Qlik Cloud Government ondersteunt geen achtergrondafbeeldingen of kleuren in werkbladen.
Doe het volgende:
- Open het werkblad in bewerkingsmodus.
- Klik onder Werkbladeigenschappen op Stijl.
- Stel Achtergrond in op Aangepast. De standaardwaarde is Auto.
-
Achtergrondkleur:
-
Enkele kleur: kies een kleur met de kleurenkiezer.
-
Op uitdrukking: stel een kleur in met een door de gebruiker gedefinieerde uitdrukking. Ga voor meer informatie naar Kleur toekennen op uitdrukking.
-
- Achtergrondafbeelding: selecteer de afbeelding in de mediabibliotheek. De standaardinstelling is Geen.
-
Klik op
 in de standaardminiatuur.
De Mediabibliotheek wordt geopend.
-
Selecteer de afbeelding die u wilt gebruiken en klik op Invoegen.
Als de gewenste afbeelding nog niet in de mediabibliotheek staat, klikt u op Nieuwe uploaden en voegt u de afbeelding toe.
- Gebruik de vervolgkeuzelijst om de grootte van uw afbeelding te wijzigen:
- Oorspronkelijke grootte
- Altijd passend
- Aanpassen aan breedte
- Aanpassen aan hoogte
- Passend maken
- Altijd vullen
- Onder Positie kunt u de uitlijning van de afbeelding wijzigen. Bijvoorbeeld: de afbeelding kan op het werkblad worden gecentreerd of rechtsboven in de hoek worden uitgelijnd.
De afbeelding en achtergrondkleur die u selecteert, zijn nu zichtbaar op het werkblad.
Werkblad in bewerkingsmodus et een achtergrondafbeelding links
