
Working with advanced options
The advanced edit mode offers further tools for customizing your sheet, as well as alternative options for working with sheets.
If you have used previous versions of Qlik Sense, you will recognize Advanced options as the previous sheet editor. The advanced edit mode contains all the features and properties previously available when editing sheets.
Unlike standard options, the advanced edit mode offers a grid on which you can drag and drop visualizations and extensions. You can then resize the visualizations to fit the preferred number of grid squares. The advanced edit mode also supports touch-only devices, unlike standard mode.
Sheet in the advanced edit mode.

Click Advanced options to switch between standard and advanced options. This allows you to develop a hybrid approach for your sheets. If you change the layout settings in the advanced edit mode, the sheet will be locked in the standard edit mode for layout editing.
The following tasks can be done in the advanced edit mode:
-
Edit the sheet properties, such as title, description, and thumbnail.
-
Add a background color or image to a sheet.
-
Change visualization properties, such as sorting and styling.
-
Copying and pasting visualizations or visualization styling.
-
Adding multiple expressions as dimensions or measures in a visualization.
-
Add custom objects to a sheet.
-
Setting show conditions for sheets.
-
Adjust grid size and layout of a sheet.
-
Add actions to a sheet.
Some visualizations can only be added in the advanced edit mode:
-
Button
-
Text & Image
-
Container
-
Analyses
-
Custom objects, such as extensions from the Dashboard bundle or Visualization bundle.
You can perform many of the same actions in advanced edit mode as you can in the standard edit mode, although there are some differences. Some of the same actions are applied in different ways. For example, visualizations are added to sheets by dragging and dropping them onto a grid in the advanced edit mode. Some actions, like filters, can only be applied in standard mode. Some sheet properties can only be set in advanced mode.
Creating a new sheet
You can create a new sheet from the application overview or from the assets panel.
Aşağıdakileri yapın:
- From the application overview, click
 to view the sheets.
 - Click
 or Create new sheet.
 - Give your sheet a title and add a description.
- Click outside the text area to save the title and description.
A new sheet is created. Your sheets are private until you make them public. For more information, see Sayfalara, sayfa gruplarına, yer işaretlerine ve hikayelere erişim verme.
Setting sheet properties
You have a wide range of ways to style your sheet and change sheet behavior in advanced mode. For more information, see the following:
Creating visualizations
Aşağıdakileri yapın:
-
In edit mode, drag the visualization from the assets panel onto the sheet or double-click the visualization.
-
Add dimensions and measures to the visualization.
You can add dimensions and measures using the buttons on the visualization. You can also drag a field from the Fields tab of the assets panel and then select it to use it as a dimension or measure The number of dimensions and measures that are required depends on which visualization you select.
If you want to add expressions as dimensions or measures, click in the properties panel, under Data, click add and then click
 .
. -
Adjust the presentation: for example: sorting, coloring, or labeling.
For more information, see Görselleştirmenin görünüşünü değiştirme.
Custom objects are added in a similar manner. You start creating a visualization by dragging a visualization extension onto the sheet. For more information, see Özel bir nesne kullanarak görselleştirme oluşturma.
You can use tab containers to save space on your dashboard, by quickly switching between tabs with different visualizations. For more information, see Sekme kapsayıcısı.
The types of data you have in your tables and fields impacts whether they can be used as dimensions or measures.
- Boyutlar, görselleştirmedeki verilerin nasıl gruplandırıldığını belirler. Örneğin: ülke başına toplam satış veya tedarikçi başına ürün sayısı. For more information, see Boyutlarla veri gruplama.
- Measures are calculations used in visualizations, typically represented on the y-axis of a bar chart or a column in a table. Hesaplamalar, bir veya birkaç alanla birleştirilmiş Sum veya Max gibi toplama işlevlerinden oluşturulan bir ifadeden oluşturulur. For more information, see Hesaplamalar.
Creating visualizations with analyses
Analyses allow you to build visualizations by starting with a type of analysis. You then select data for the analysis to use and then the analysis generates a chart. You can then adjust analysis-specific properties and style the visualization.
In analysis mode, analyses are identical to other visualizations.
Analyses are available from Analyses in the assets panel. For more information, see Analizleri oluşturma ve düzenleme.
Creating visualizations with chart suggestions
Chart suggestions functions similarly to the autochart in the standard edit mode. You can turn on chart suggestions in the properties panel. When turned on, as you add or remove fields, the suggested visualization adjusts itself based on your changes. You can customize a suggested visualization with a focused set of properties.
For more information, see Insight Advisor grafik önerilerini kullanarak görselleştirme oluşturma.
Moving visualizations
Aşağıdakileri yapın:
-
Click and drag visualizations to reposition them on the grid.
Copying visualizations
In advanced options, you can copy and paste visualizations in the following ways:
- Using the edit bar on the sheet (
 ,
,  , and
, and  ).
). - By right-clicking and selecting Cut, Copy and Paste.
- With the keyboard shortcuts Ctrl+C, Ctrl+X and Ctrl+V.
Depending on what situation you are in, different things will happen when you paste a copied visualization on a sheet while using advanced options:
- If a visualization is selected, then the selected visualization will be replaced.
- If no visualization is selected, then the pasted visualization will be placed in the largest empty space.
- If there is no empty space, then the largest visualization on the sheet will be split in half to make space for the pasted visualization.
For more information about copying and pasting visualizations, see Bir görselleştirmeyi, mevcut görselleştirmeden kopyalama.
Copying and pasting visualization styling
If you have applied custom styling to a visualization, you can copy its styling properties and paste them onto another visualization. For more information, see Görselleştirme stilini kopyalayıp yapıştırma.
Converting visualizations
You can convert visualizations by clicking and dragging them onto another visualization.
Aşağıdakileri yapın:
-
While editing a sheet, drag a new chart from the assets panel onto the visualization that you want to convert.
Kısayol menüsü açılır.
-
Select the conversion option.
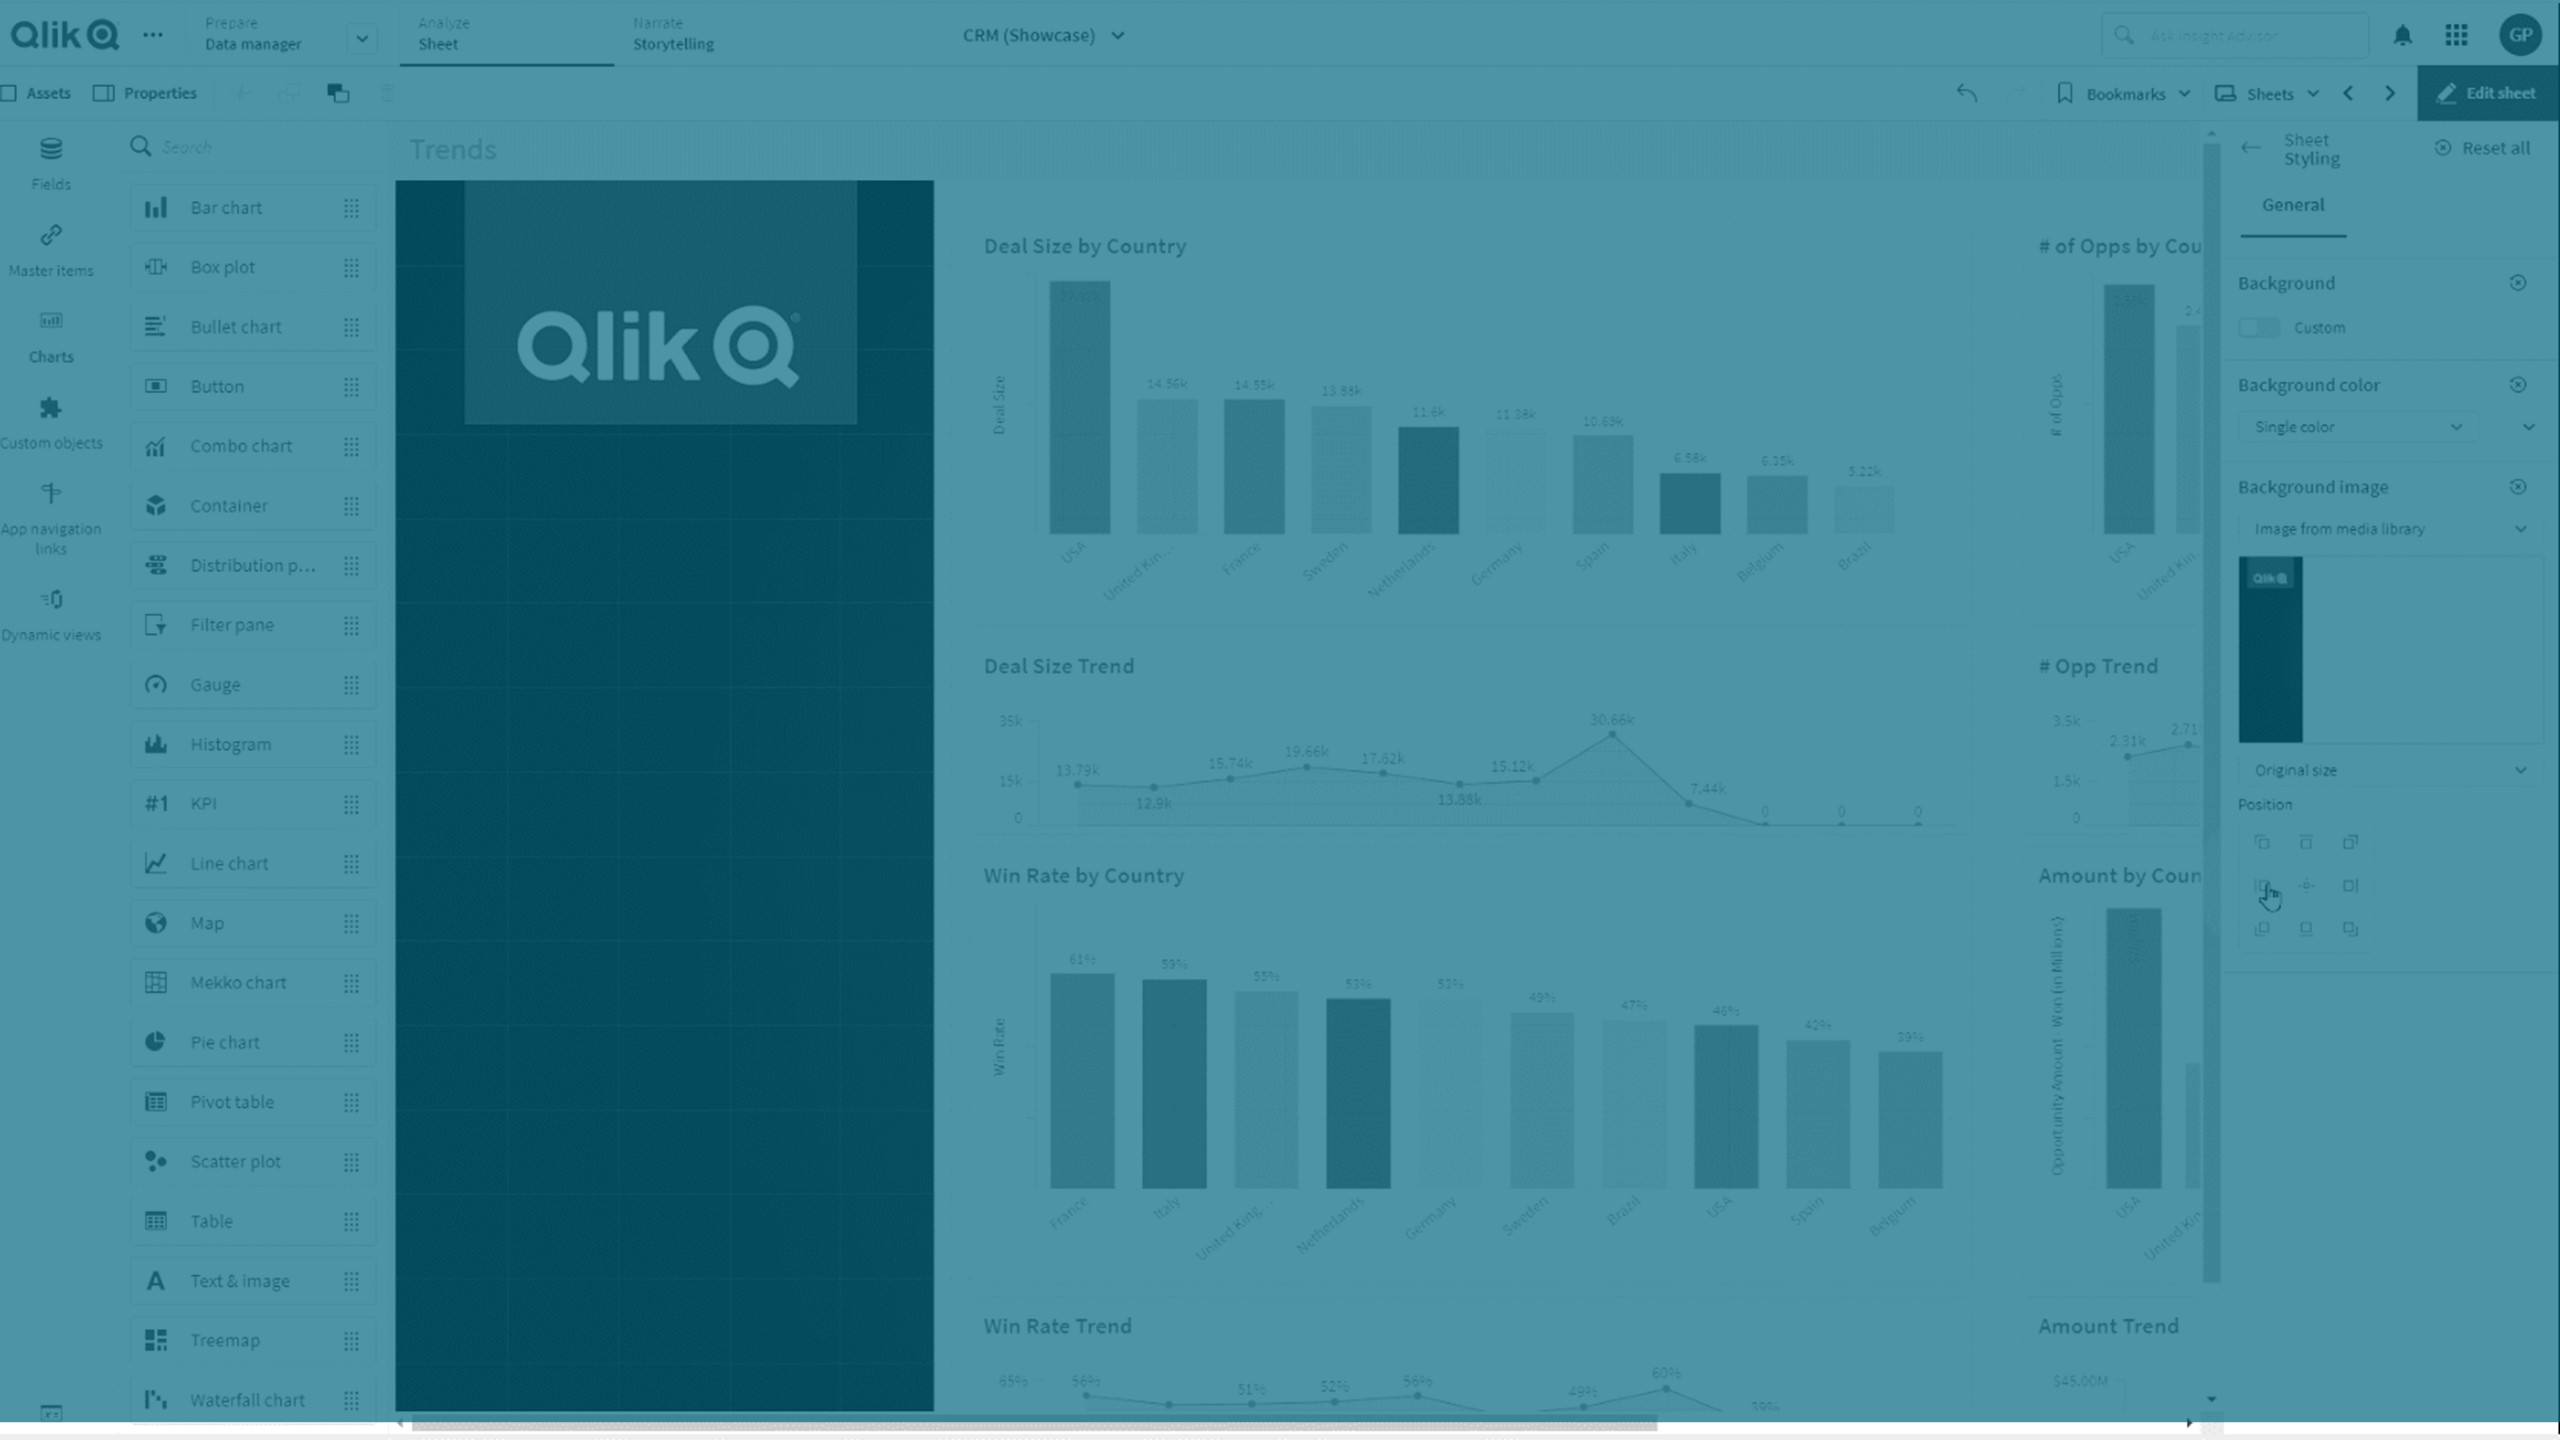
Arka plan rengi veya görüntüsü ekleme
Bir sayfanın arka planını özelleştirebilirsiniz. Belirli bir arka plan rengi seçebilir veya ifadeye göre renklendirme yapabilirsiniz. Medya kitaplığındaki herhangi bir görüntü arka plan olarak ayarlanabilir. Arka planın tamamını kaplamaması için görüntünün konumu değiştirilebilir veya boyutu düzenlenebilir.
Şu biçimler desteklenir: .png, .jpg, .jpeg ve .gif. .gif dosyası kullanırsanız animasyonlu veya statik olabilir.
Qlik Cloud Government, sayfalarda arka plan görüntülerini veya renklerini desteklemez.
Aşağıdakileri yapın:
- Sayfayı Düzenleme modunda açın.
- Sayfa özellikleri bölümünde Stil seçeneğine tıklayın.
- Arka plan ayarını Özel olarak belirleyin. Varsayılan değer Otomatik'tir.
-
Arka plan rengi:
-
Tek renk: Renk seçiciyi kullanarak bir renk belirleyin.
-
İfadeye göre: Kullanıcı tarafından belirlenen bir ifade kullanarak bir renk ayarlayın. Daha fazla bilgi için bk. İfadeye göre renklendirme.
-
- Arka plan resmi: Medya kitaplığından resim seçeneğini belirleyin. Varsayılan değer Yok'tur.
-
Varsayılan küçük resimde
 seçeneğine tıklayın.
Medya kütüphanesi açılır.
-
Kullanmak istediğiniz resmi seçin ve Ekle'ye tıklayın.
İstediğiniz resim medya kitaplığında yoksa Yeni yükleme'ye tıklayın ve görseli ekleyin.
- Resminizin boyutunu değiştirmek için açılır menüyü kullanın.
- Orijinal boyut
- Her zaman sığdır
- Genişliğe sığdır
- Yüksekliğe sığdır
- Sığdırmak için genişlet
- Her zaman doldur
- Konum bölümünde, resmin hizasını değiştirebilirsiniz. Örneğin, resim sayfanın ortasında veya sağ üst köşesinde olabilir.
Seçtiğiniz resim ve arka plan rengi sayfaya yansır.
Solda arka plan resmi ayarlanan, Düzenleme modunda sayfa
