Working with sheets
Organize data visualizations for your app consumers in sheets. Make it easier for them to analyze data by structuring your ideas and defining the purpose of your app.
Sheets are components of Qlik Sense apps that group and present visualizations of your app data. Visualizations are charts or other representations of app data, such as bar charts and pie charts. App consumers can use your sheets and visualizations to explore data to find insights and make discoveries.
Sheets are developed in edit mode and viewed in analysis mode. Analysis mode is the standard view of a sheet most of your app users will see. In it, users can make selections in the data that is displayed in visualizations. Selections are applied to all visualizations in the app, enabling users to explore your app's data in depth.
To learn more about selections and exploring data in visualizations, see Exploring with selections and Exploring data with visualizations.
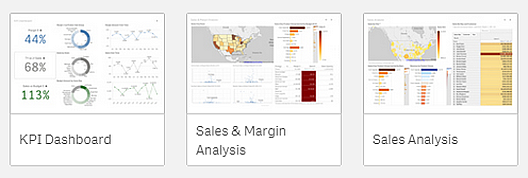
Sheet in analysis mode with filter panes on the left to select and filter data

Build sheets for your app in edit mode. When you create a new app, it is good practice to first build a structure of empty sheets, where each sheet represents an idea or a goal. This gives a good overview of the app. For example, you are creating an overview of your company's key metrics, sales, and margins by state, region, and product. Instead of having all this information in one place, you could structure it by having one sheet for each purpose.
Each sheet has a purpose and an idea of its own

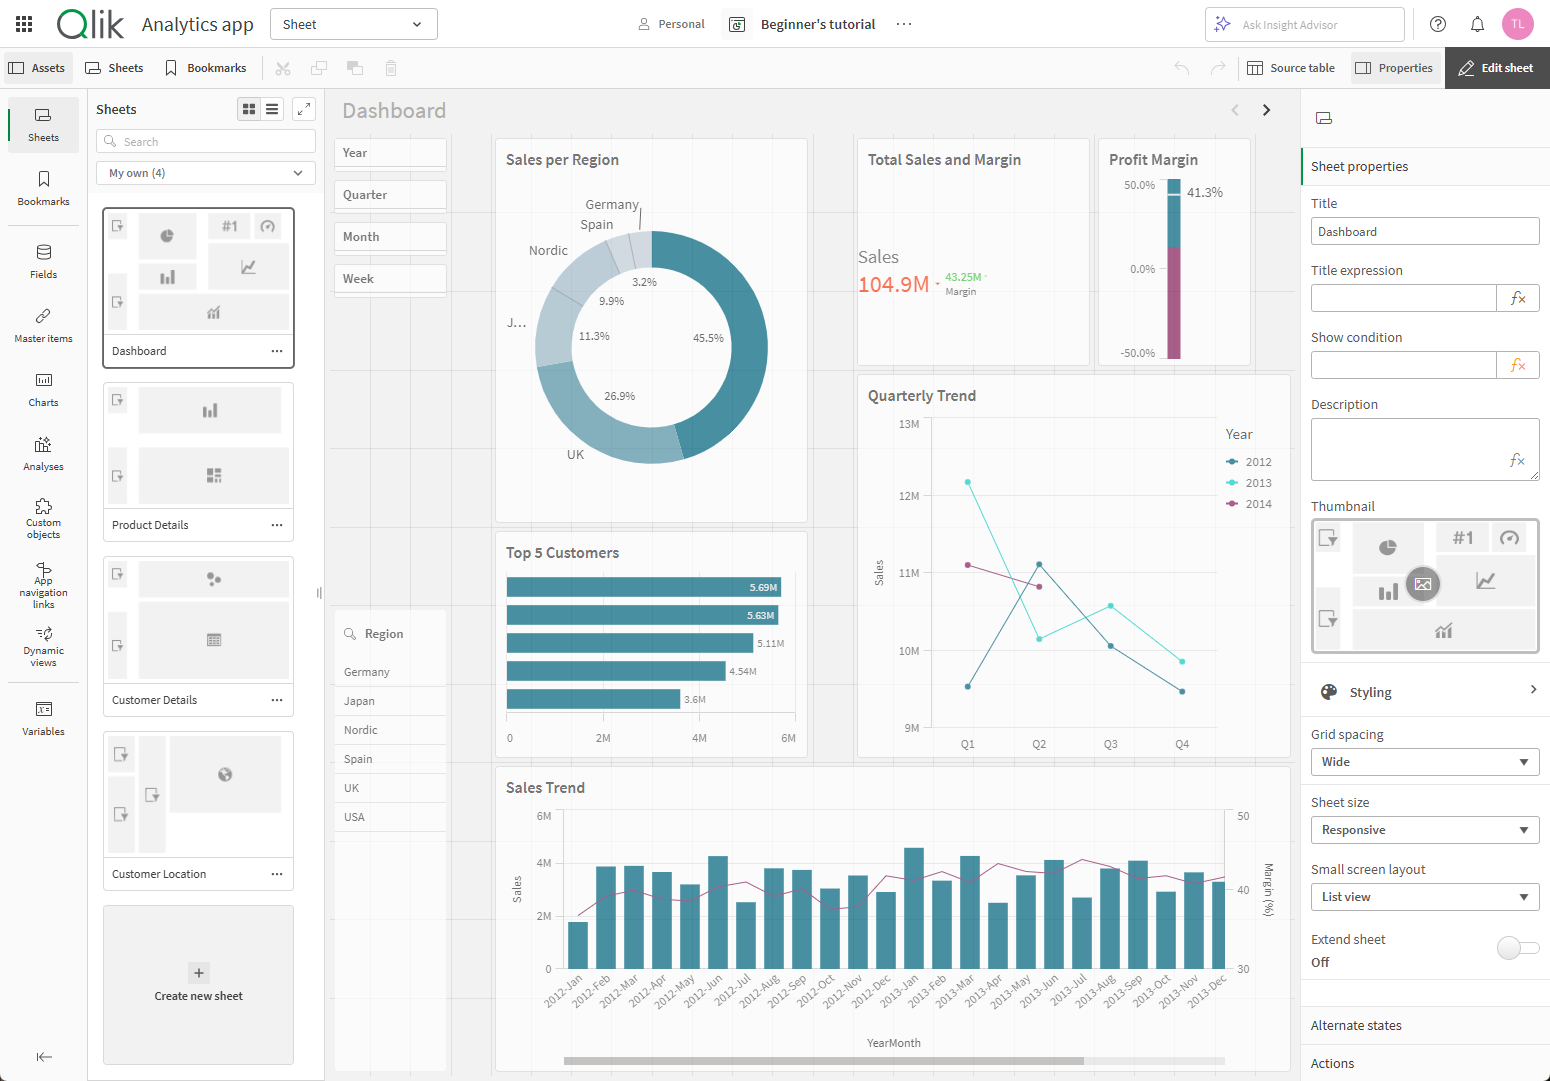
Click Edit sheet in an open sheet to start building a sheet. The edit mode interface helps you quickly create visualizations and lay them out in a sheet. With edit mode's smart grid, you can quickly place new visualizations beside or below a chart and drag them into their final positions. You can easily create filters in your visualizations, limiting the data that displays in the charts.
Sheet in edit mode

You can continue to make selections in visualizations while editing a sheet. This helps you test out your visualizations as you develop your sheets.
In edit mode, you can do the following:
-
Add new charts.
-
Change the sheet title.
-
Edit sheet layouts and properties.
-
Add filters to your charts.
-
Reload app data (if you have permission in the space).
-
Add data to your app (if you have permission in the space).
-
Add new sheets.
You can organize your sheets in groups. This allows you to collect related sheets together into collapsible groups in both the app overview and assets panel for easier navigation. For more information, see Grouping sheets.
Permissions
Editing sheets requires that you have Professional or Full User entitlement and that you have appropriate permissions to add or edit sheets in the space the app is in. In shared spaces, you can create and edit sheets with the following permissions:
-
Owner
-
Can manage
-
Can edit data in applications
-
Can edit
In managed spaces, you can create and edit sheets with the following permissions:
-
Owner
-
Can manage
-
Can contribute
Limitations for app content that will be shared or exported
Apps, sheets, and charts are shared and exported in several ways. Technical limitations can affect whether these capabilities function as intended. If your app exceeds these technical limitations, the sharing or exporting capabilities will not work.
For specific lists of these limitations for each capability, see:
