
Applying filters to visualizations
In the sheet edit mode, apply filters to visualizations to narrow the focus of a field to a specific subset of data. For example, if you have a field containing countries, you could use filters to only display data for specific countries of interest.
To apply a filter to a visualization, select a field and then select the type of filter used. You can apply several different kinds of filters to your visualization. You can filter using:
-
Values: Filter using selected values from a field. For example, filter results to include only those values you select from a field.
-
Search: Filter using matches from a search. For example, filter results to include only those that start with a specific code prefix.
-
Condition: Filter matching specified conditions. For example. filter results to only include those that meet a numeric threshold.
-
Clear selection: Filter to exclude selections made in other visualizations. For example, selecting a field whose selections made in other visualizations will not be applied to this visualization.
Filters can only be applied to fields. You can apply multiple filters to a visualization. Filters can only be applied to visualizations containing a measure.
You can also create complex filters with set analysis. For more information on set analysis, see Set analysis.
Viewing and interpreting the applied filters
The filters applied to a visualization are shown in the footnote at the bottom of the visualization. You can see the filters applied to the chart regardless of whether you are developing or consuming the analytics.
Adding a footnote to a visualization will remove the Filters applied footnote.
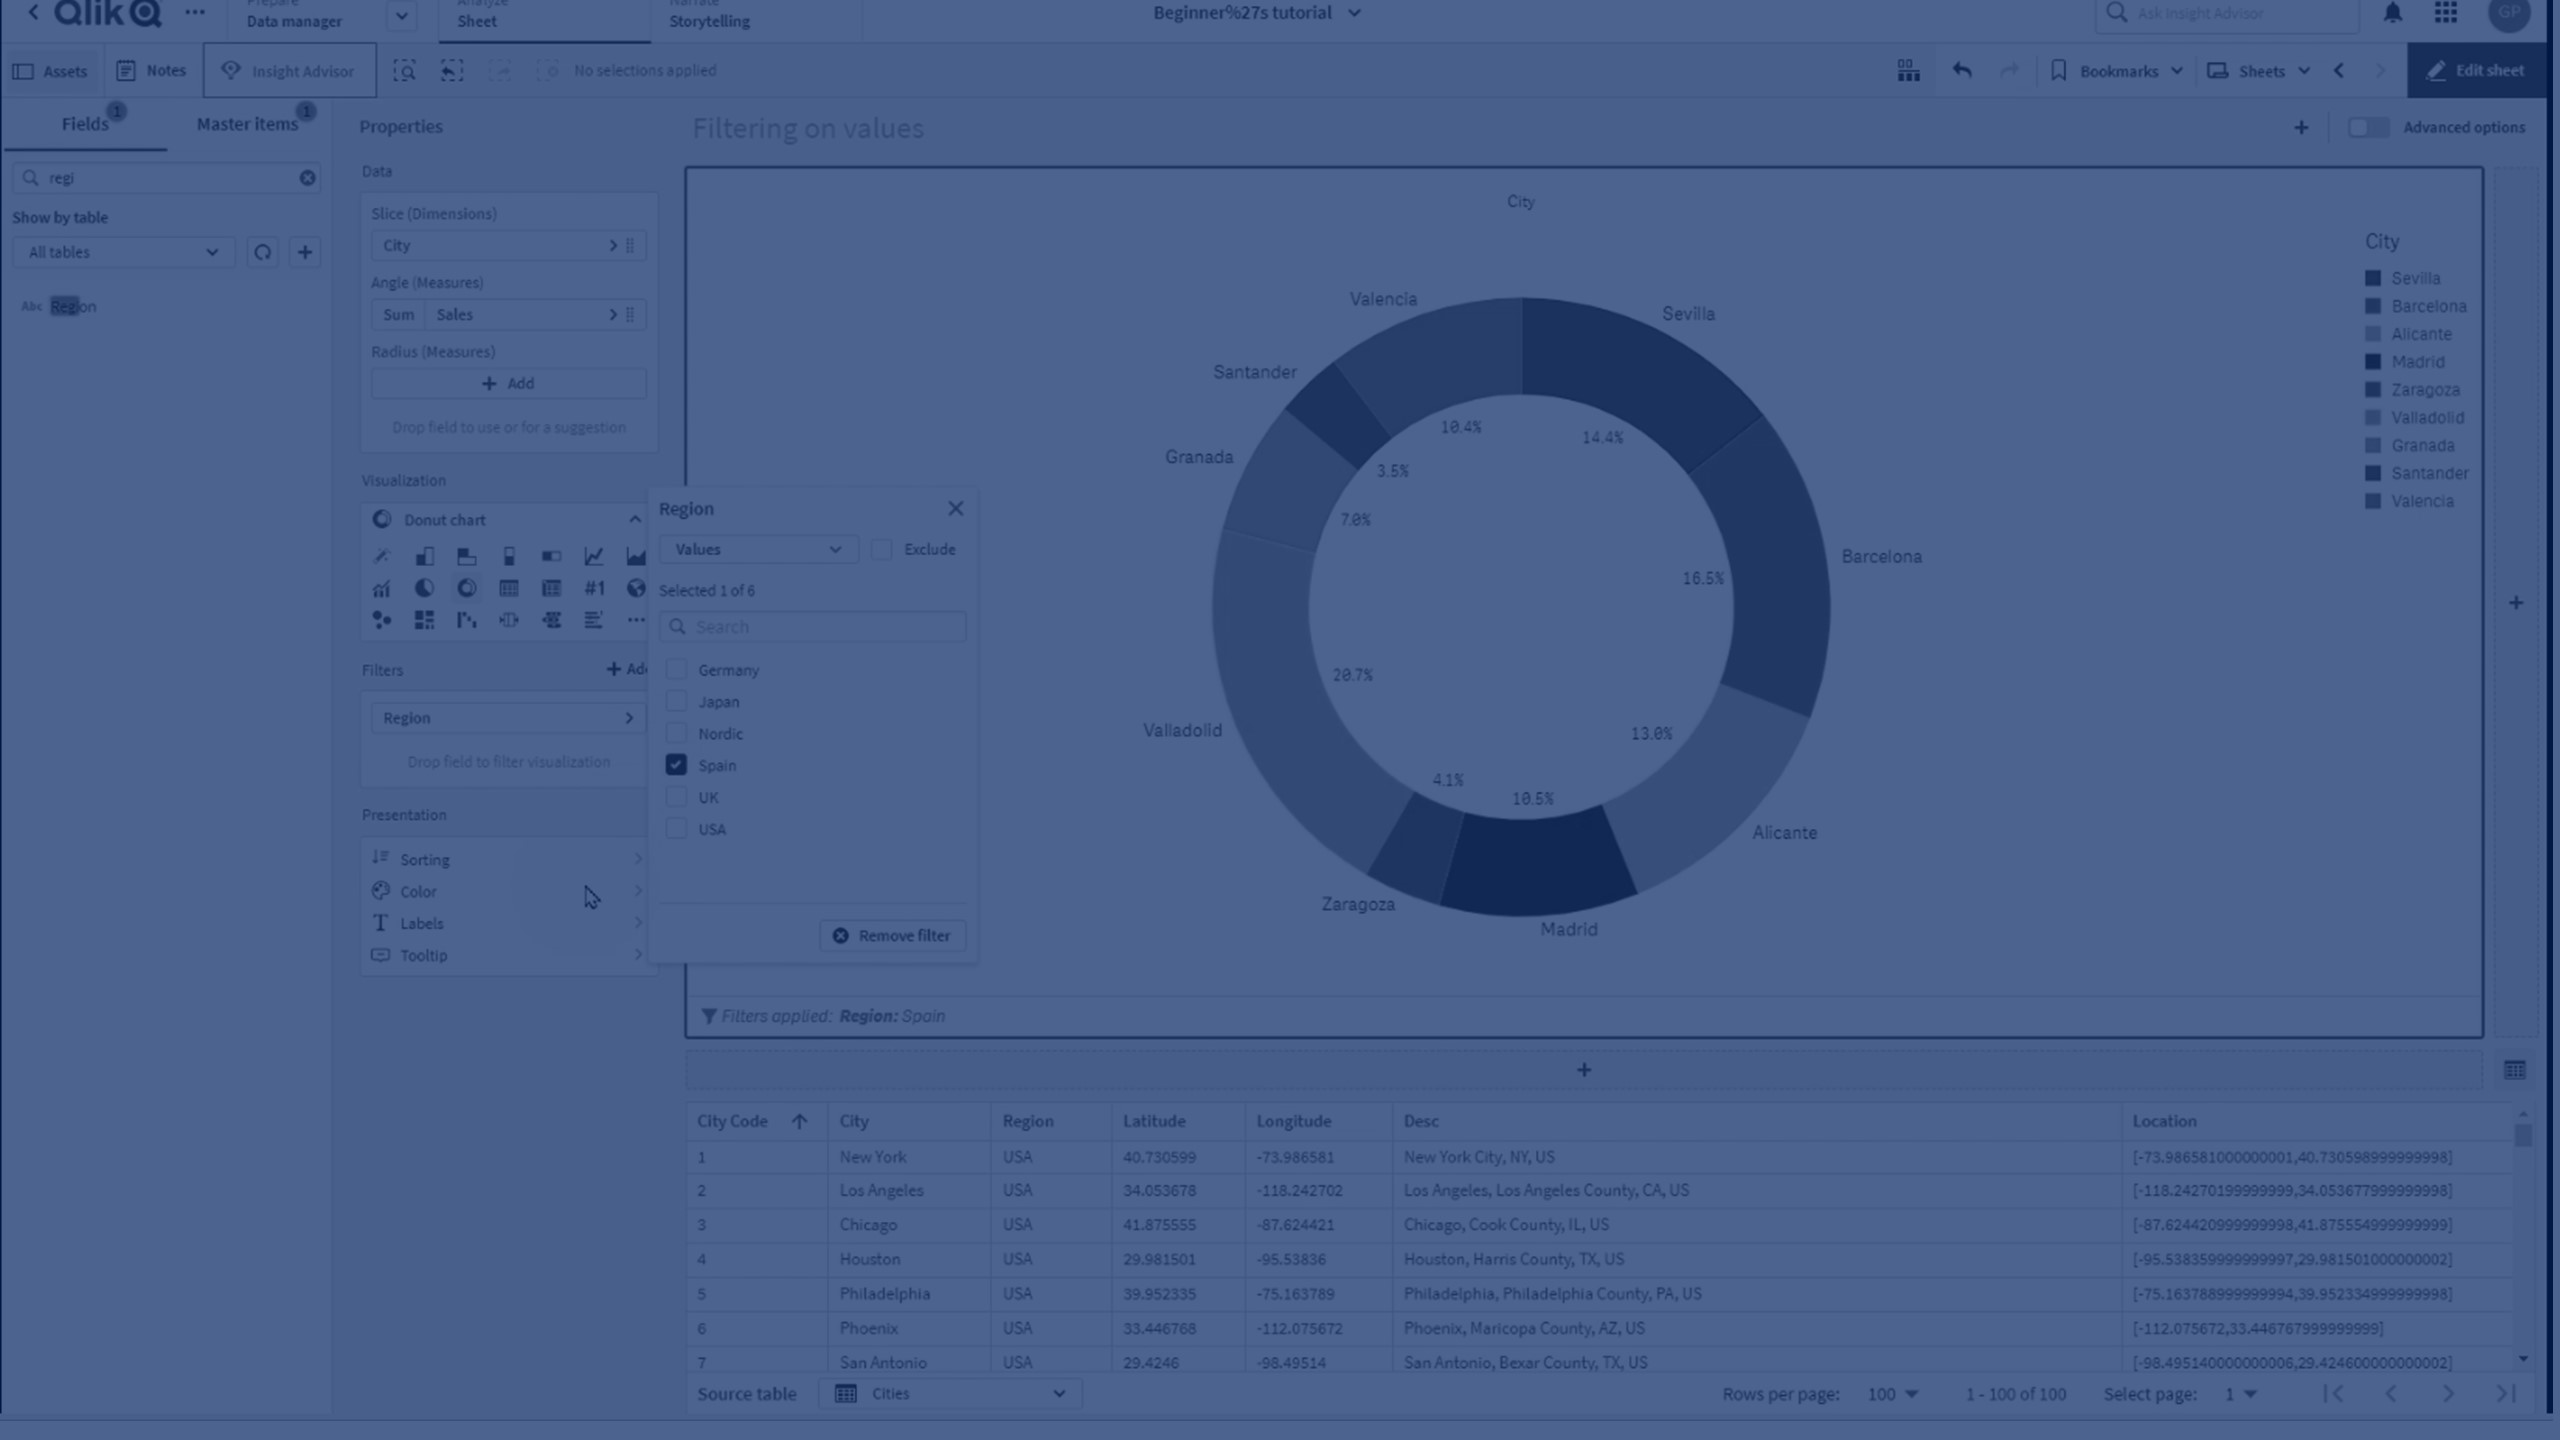
A chart with filters applied

The format of the filters listed in the Filters applied footnote depends on how you have configured the filters.
Values filter
If you have applied a Values filter, the values selected are shown. For example: Region: Japan, Nordic, Spain
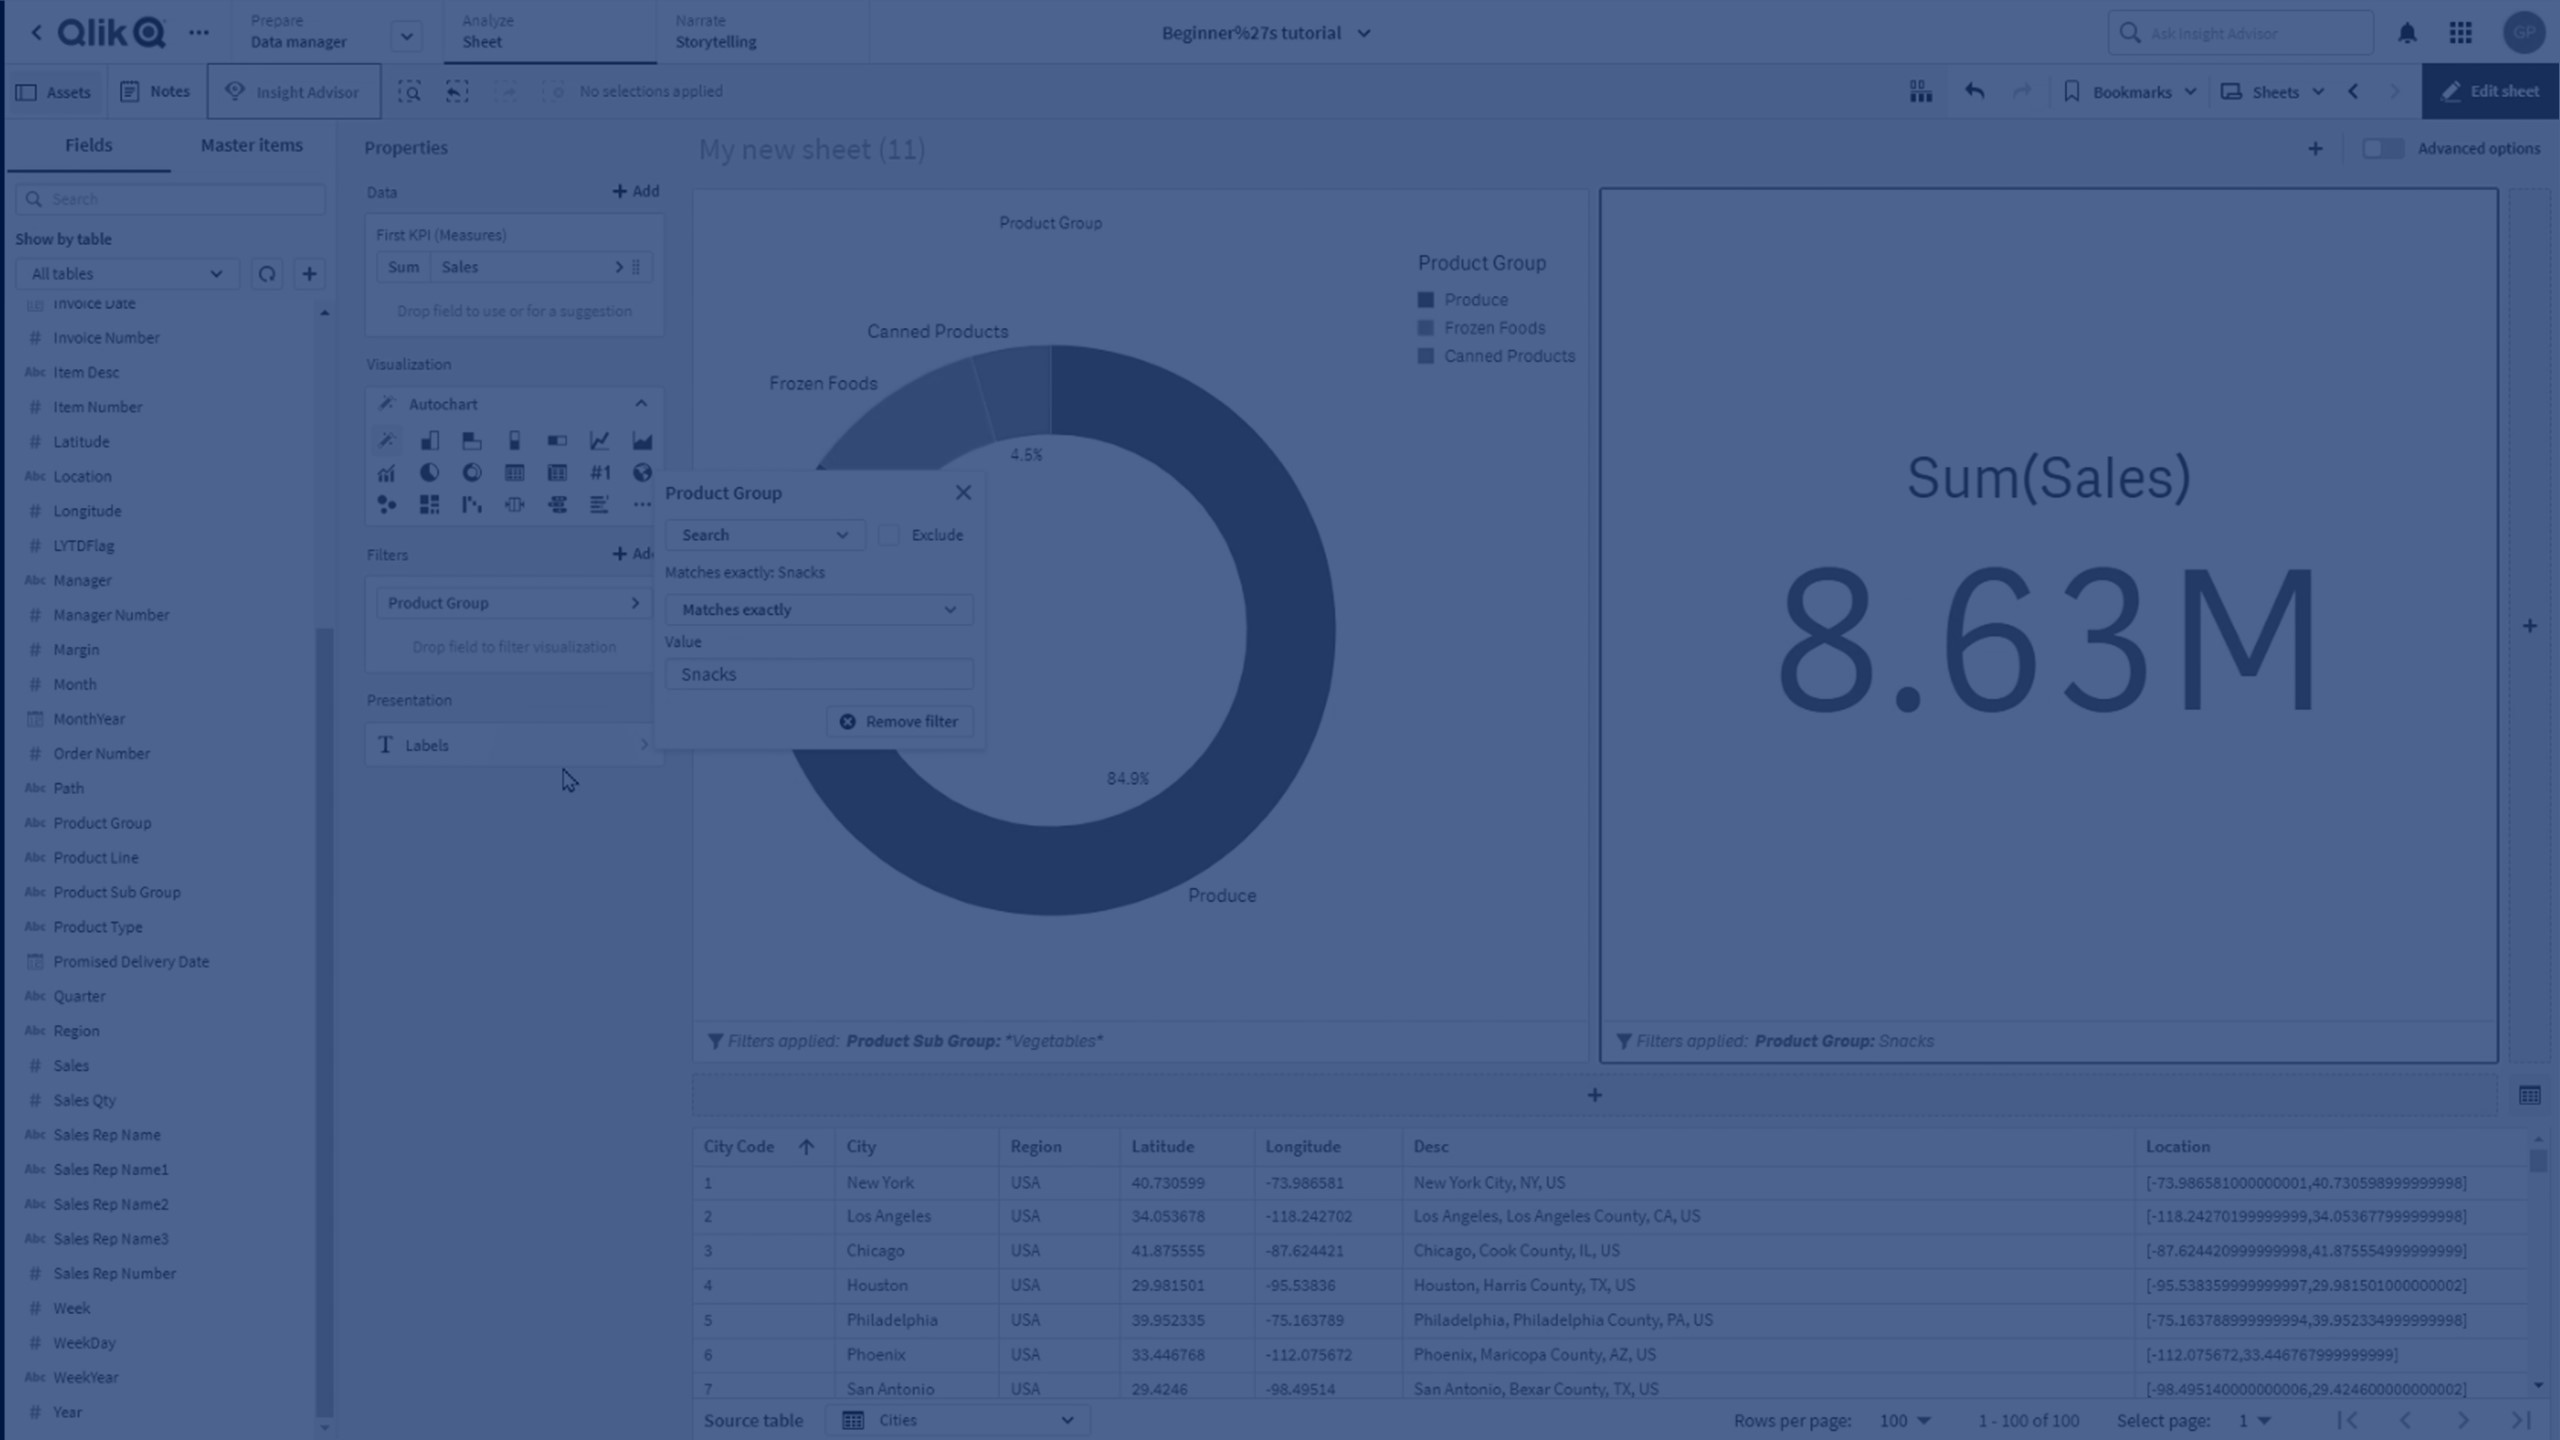
Search filter
For filters with the Search option, the search value is displayed with wildcard symbols as needed:
-
The * wildcard is used in the place of zero or more characters, including spaces. This wildcard is flexible and matches any character or any block of characters in a specific position.
-
The ^ wildcard is used to filter values by the character or characters at the beginning of a word within a field value. This wildcard is only used in conjunction with other wildcards.
For example: City: *^New*. In this example, the City field is being filtered to only show field values that begin with the string New. This could, for example, include values such as New York, New Orleans, and Newark.
Condition filter
For filters with the Condition option, operators and other symbols are used. Depending on the configuration, a filter might show:
-
A simple combination of field and operator. For example: Year: >2022. A visualization with this filter would only include data with a Year of later than 2022.
-
An advanced expression using one or more equals signs. For example: Product: =sum(Sales)>1000000. A visualization with this filter would include Product items that have total Sales exceeding 1000000.
Clear selection filter
For filters with the Clear selection option, the text ALL is displayed along with the filter field to indicate that none of the field values will ever be hidden in the chart. For example: City: ALL
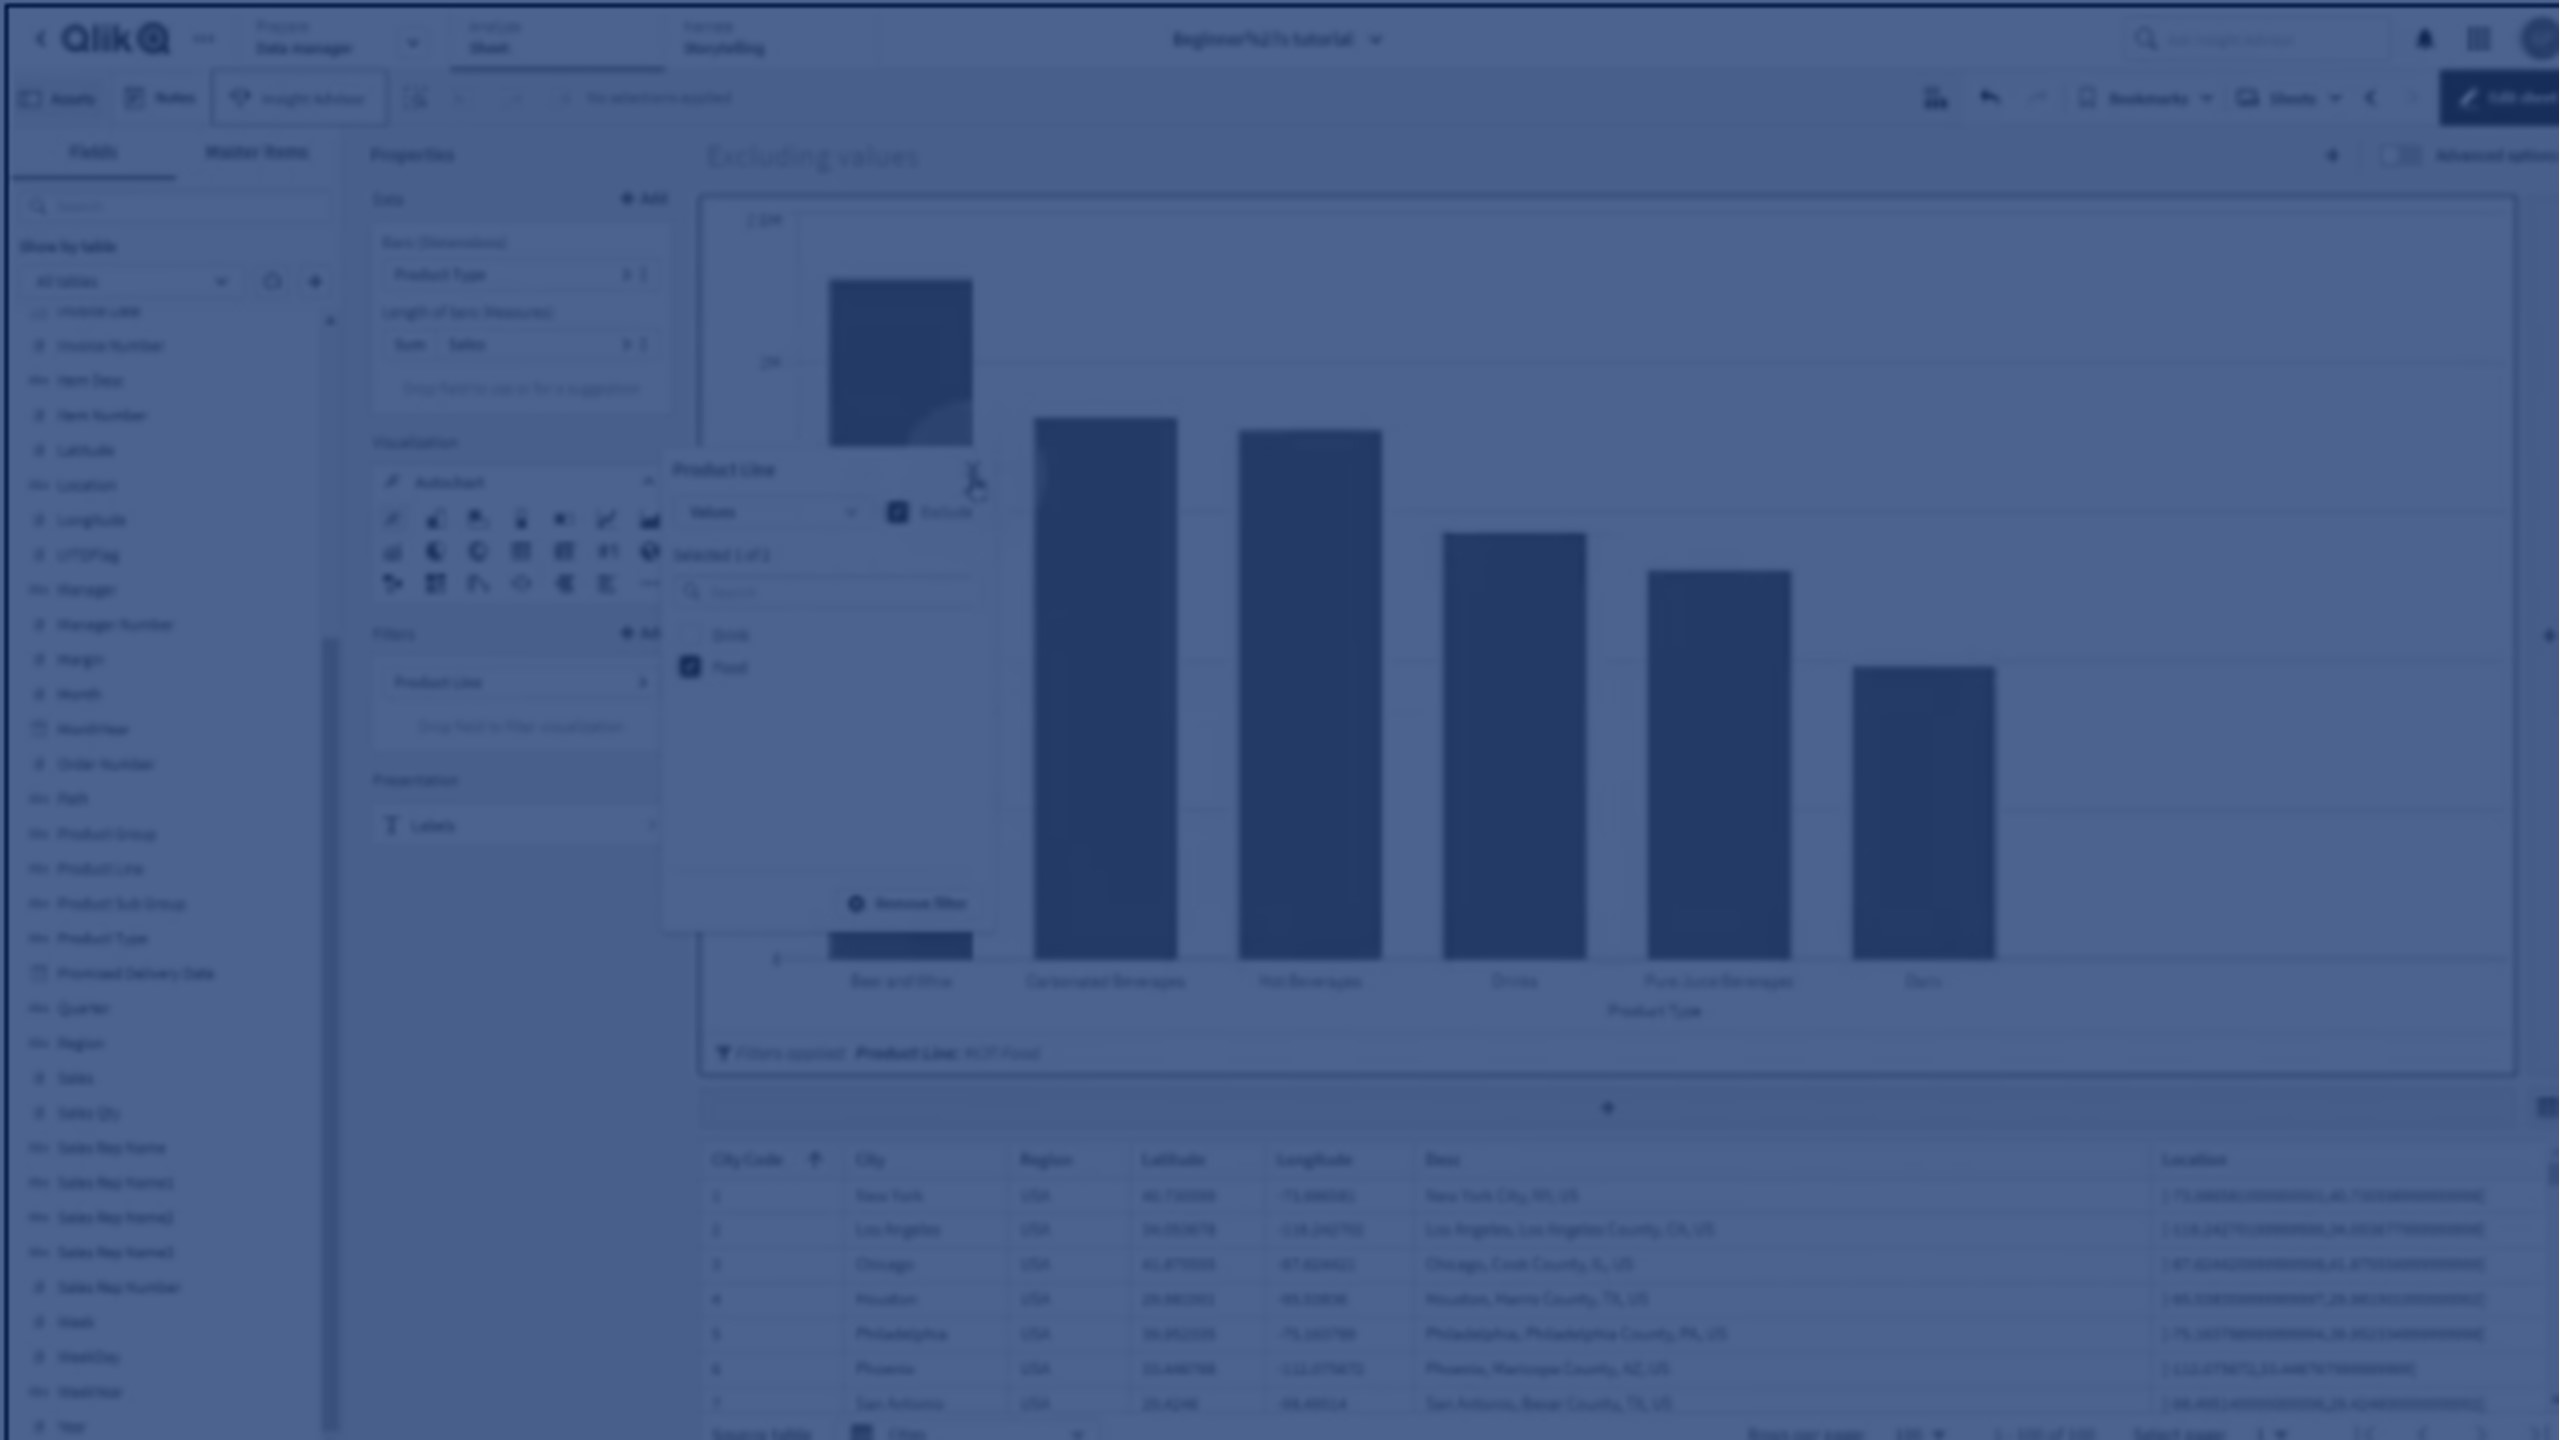
Filters that use Exclude
Any filters that use Exclude will contain the text NOT, along with the filter. For example: Region: NOT Sweden
Filtering with values
Filter data by selecting values from a field to include or exclude from the visualization. This is useful if you want to quickly limit the scope of dimension values in your visualization. For example, if you included a field that contained clients of your organization, you could use a value filter to only include results for specific clients.
Do the following:
-
In edit mode, select the visualization to which you want to apply a filter.
-
In the properties panel, in Data, under Filters, click Add and select a field.
-
Expand the field and select Values.
-
Optionally, to exclude the selected values, select Exclude.
-
Select the values to include or exclude from the list.
Filtering with searches
Filter values based on searches for the specified values in the field. This is useful when you want to filter on data based on a partial phrase or string. For example, you have a field that contains record IDs for your organization. Each record ID includes a specific prefix to classify the record. You could use a search filter to filter on the record prefixes.
The following search types are included:
-
Contains: Any strings that contain your entered search value. For example, entering je will return any strings containing je.
-
Matches exactly: Any exact matches with your entered search value. For example, entering je would return all instances of the string je.
-
Starts with: Any strings that start with your entered search value. For example, entering je would return jeans and jean shorts, but not blue jeans.
-
Ends with: Any strings that end with your entered search value. For example, entering gg would return egg, but not eggs.
-
Beginning of word: Any words in a string that start with your entered search value. For example, entering je would return jeans, jean shorts, and blue jeans.
The search filter works best with string values, but you can search for numeric values as well.
Do the following:
-
In edit mode, select the visualization to which you want to apply a filter.
-
In the properties panel, in Data, under Filters, click Add and select a field.
-
Expand the field and select Search.
-
Optionally, to exclude the selected values, select Exclude.
-
From the list, select the type of search to use.
-
Enter the value for which to search.
Filtering with conditions
Filter on conditions in a selected field or filter on a comparison between two fields. For example, you could filter all values from a field that are under a threshold value. Your conditions can use fixed values or calculated values.
You can compare to a fixed value or you can compare it to a calculated value from a measure. For example, you could include all values whose Sales value is over $1,000 or you could include all values whose Sales value is over the average Gross Sales value.
Condition supports two kinds of filters: Compare and General.

Filtering with comparison conditions
Compare looks at values from your selected field and compares them to a specified condition. For example, you could take the field Sales and filter out all sales under $5,000 from being included in the visualization.
Do the following:
-
In edit mode, select the visualization to which you want to apply a filter.
-
In the properties panel, in Data, under Filters, click Add and select a field.
-
Expand the field and select Condition.
-
Optionally, to exclude the selected values, select Exclude.
-
Select Compare.
-
Under Condition, select the condition to use and whether to use a fixed value or a calculated value.
-
If you are using a fixed value, enter the value or values required for your condition.
-
If you are using a calculated value, select the modifiers and fields to create the measures that define the comparison condition.
Filtering with general conditions
General uses an aggregation to filter your data. First you define a measure. Then it filters matching values from your selected field based on the conditions you specify for that measure.
For example, you have a chart showing regional sales figures. You want to see regional sales figures only where the sum of sales for cities in that region was over $1,000,000. You add City as the filter. For your general condition, you set the field as (sum)Sales with the condition Greater than or equal to 1000000.
Do the following:
-
In edit mode, select the visualization to which you want to apply a filter.
-
In the properties panel, in Data, under Filters, click Add and select a field.
-
Expand the field and select Condition.
-
Optionally, to exclude the selected values, select Exclude.
-
Select General.
-
Under field, select the modifier and field to use to specify the measure to use in the filter. For example, (avg)Sales.
-
Under Condition, select the condition to use and whether to use a fixed value or a calculated value.
-
If you are using a fixed value, enter the value or values required for your condition.
-
If you are using a calculated value, select the modifiers and fields to create the measures that define the comparison condition.
Filtering by clearing selections
Exclude external selections for the selected field in this chart. When you select clear selection, any selections made in other charts for the selected field are ignored. However, selections made on that field within this chart would be reflected in other charts.
For example, I have a chart that only shows results from Region for Germany, Japan, and Spain. I do not want selections made in other charts for Region to impact this chart. By selecting Region to be filtered with clear selection, other Region selections outside this chart will not impact the chart.

Do the following:
-
In edit mode, select the visualization to which you want to apply a filter.
-
In the properties panel, in Data, under Filters, click Add and select a field.
-
Expand the field and select Clear selection.
Advanced alternatives to visualization filters
Visualization filters are helpful for building visualizations quickly. For more advanced use cases, you might want to use set analysis instead, or use a combination of visualization filters and set analysis. For example:
You have created a sheet where all visualizations on the sheet need to have the same filter. Other sheets in the application need to use a similar arrangement of visualizations, but with different filters on the same field. You can add filters individually to each visualization on the sheet. Alternatively, you can use any of the following:
-
Set analysis. With set analysis, data is filtered using an expression rather than by applying filters. For example, on one sheet, a bar chart could use =Sum({<ProductType={'Grocery'}>} Sales) as a measure, to filter for the Grocery field value. In the next sheet, a similar bar chart could use =Sum({<ProductType={'Dairy'}>} Sales) as a measure, to filter for the Dairy product category.
For more information on set analysis, see Set analysis.
-
Bookmarks. For example, rather than creating multiple sheets with the same arrangement, you could create a single sheet containing no filters, and then create bookmarks in the application to allow users to control the filters (selections) themselves.
Limitations
Filters have the following limitations:
-
Filters are not supported in the following visualization types:
-
Box plot
-
Button
-
Filter pane
-
Histogram
-
Navigation menu
-
Tab container
-
-
Filters are only supported in chart layers in map charts.
-
Filters are not supported with the following objects from the Visualization Bundle:
-
Trellis container
-
-
Filters are not supported with the following objects from the Dashboard bundle:
-
Animator
-
Date picker
-
Layout container
-
Line
-
Variable input
-
Video player
-