
Downloading application content
The data behind a visualization can be downloaded as a Microsoft Excel file. You can also download visualizations as images or PDF files. Sheets and stories can be downloaded as PDF. The Download dialog lets you configure output settings.
When downloading application content, consider the following details:
-
You must allow pop-ups in your browser to download application content.
-
The download process looks different if you are using a touchscreen device. See: Long-touch menu on touch devices.
-
If you use a custom theme, styling may not display as intended in images and PDFs.
Data
When you download visualization data, the Download dialog generates a Microsoft Excel file. If data download is not available for the selected chart, you will see a preview of the image download.
For straight tables, the Download dialog also allows you to decide whether to include titles, totals, and current selections in the exported file. For more information, see Downloading a straight table as data.
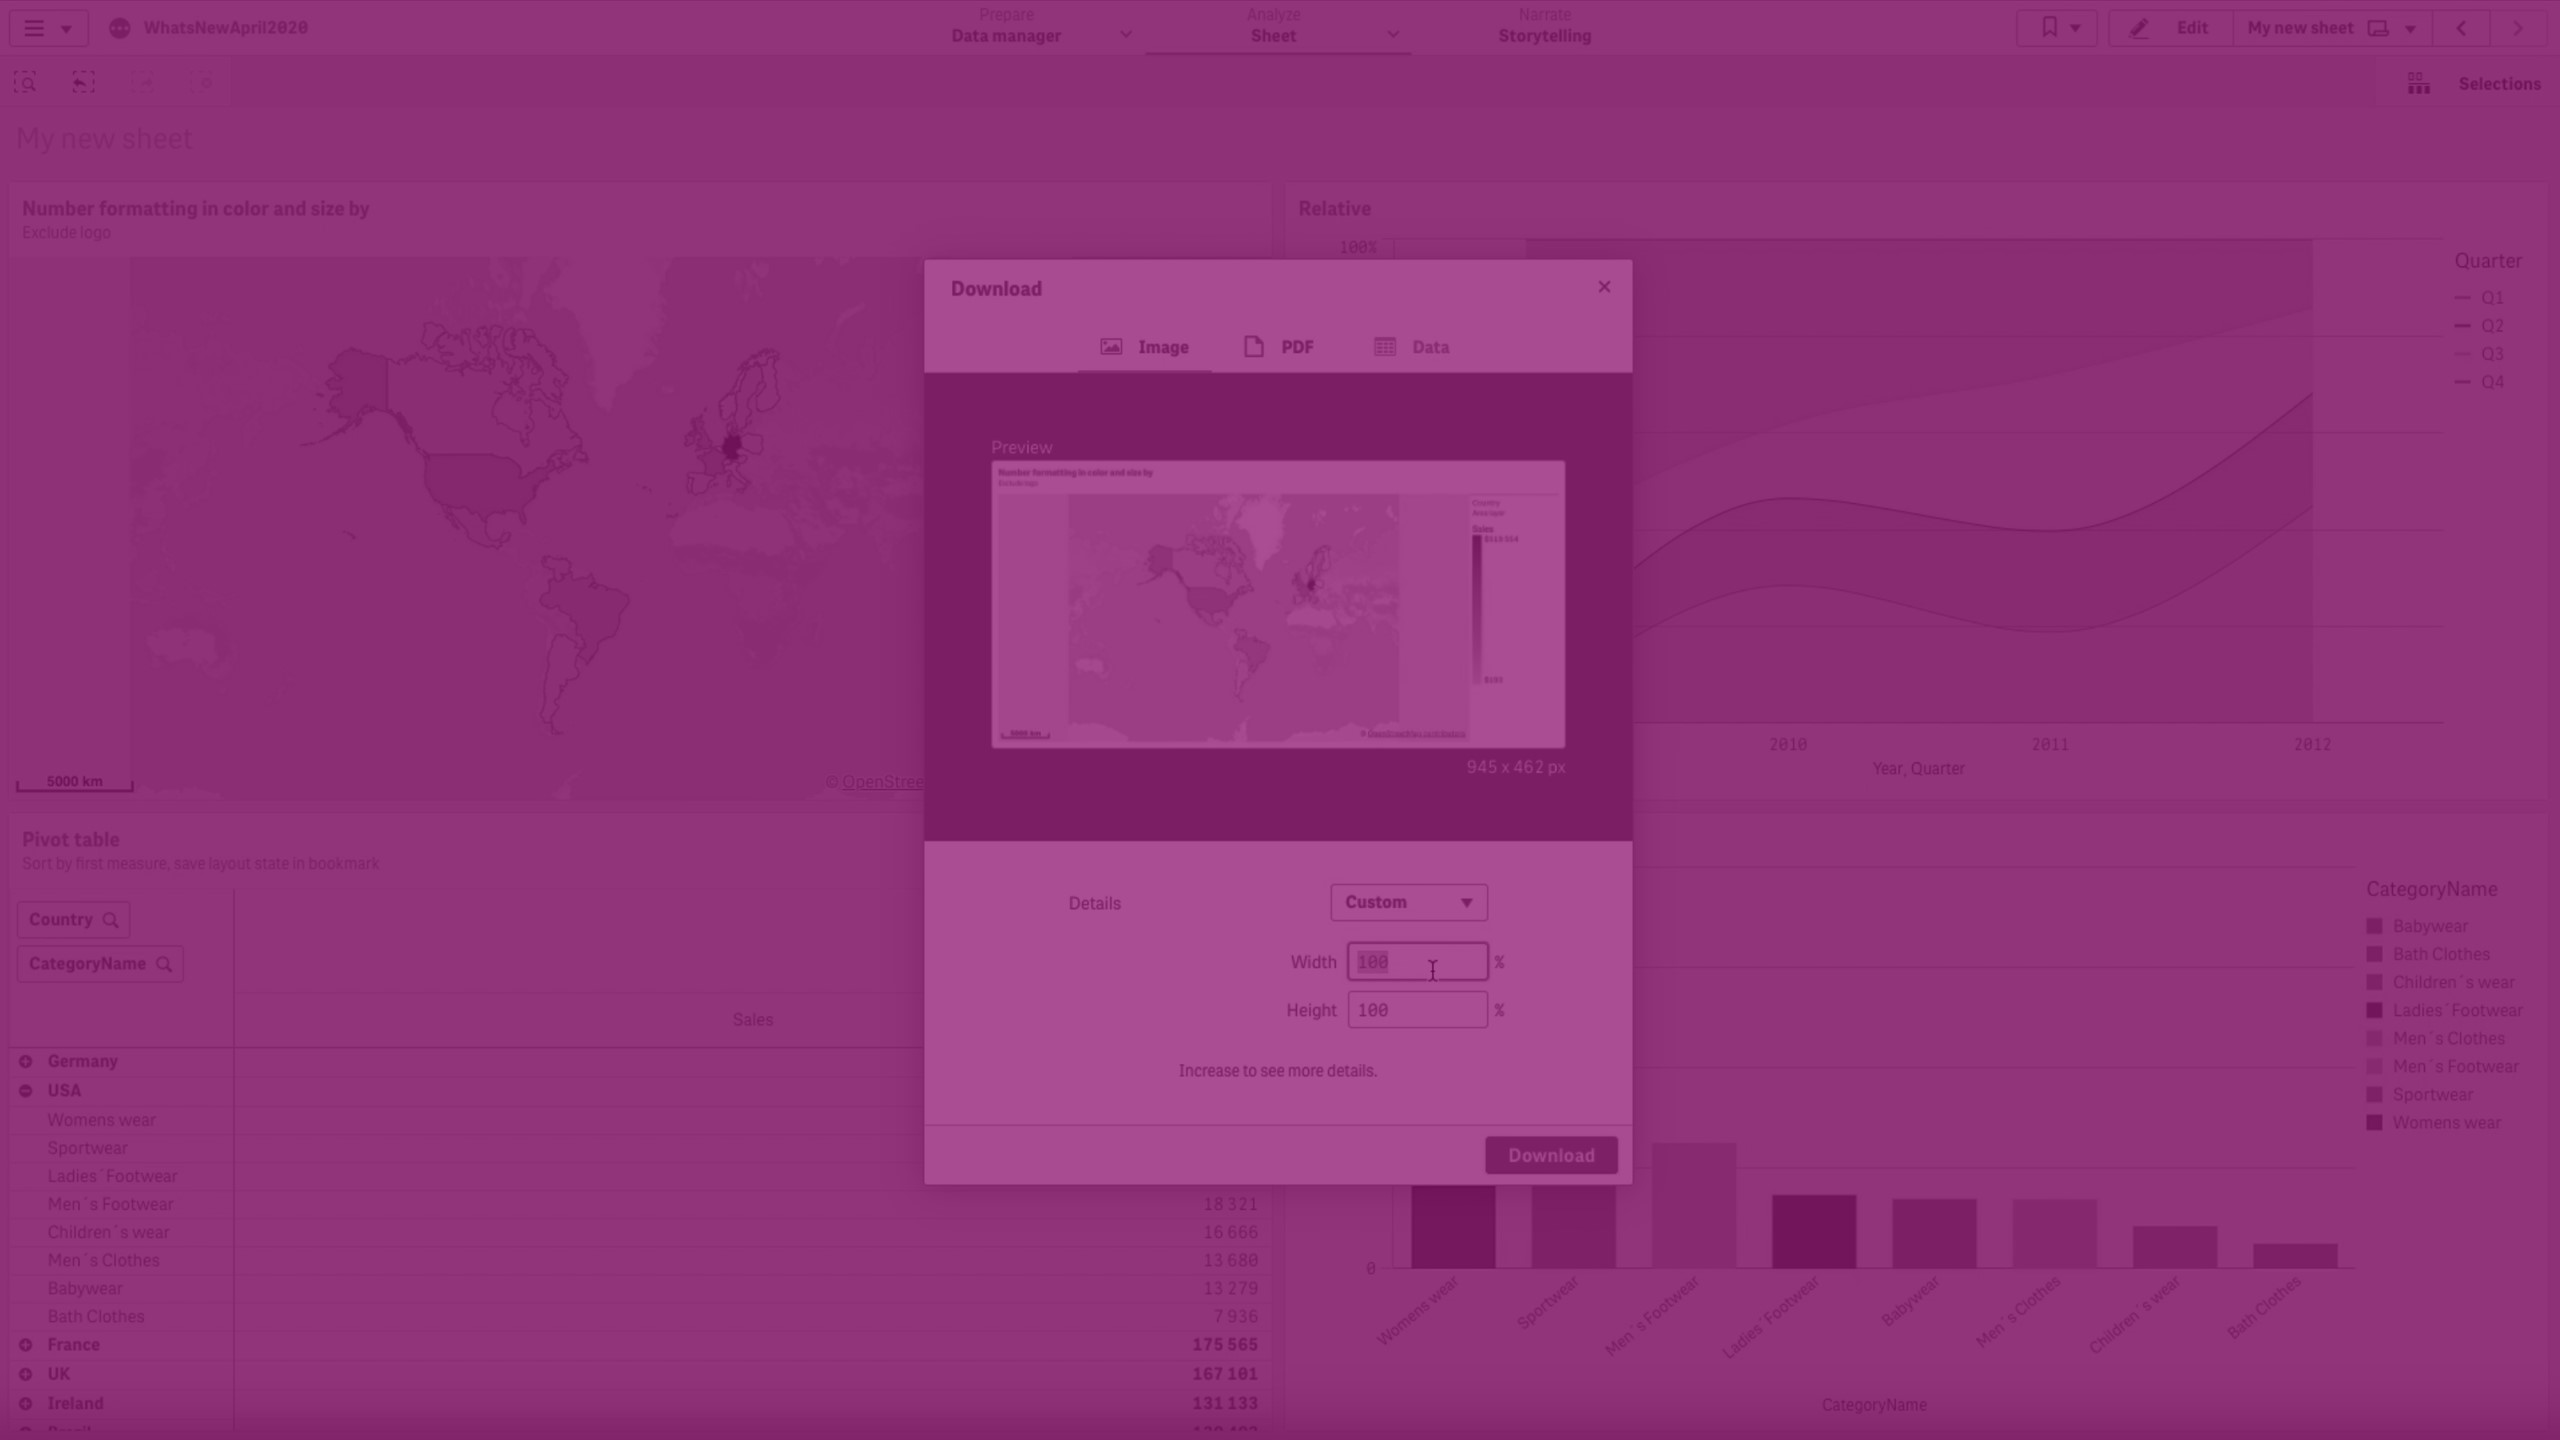
Images
By default, a downloaded image contains the current view of displayed data or details. You can customize the amount of data or details displayed by adjusting width and height. The preview of the image adjusts as you make your changes. Images are downloaded in PNG format.
PDFs
You can download a PDF of an entire sheet or an individual visualization. PDF resolution is 300 DPI. You can select the page orientation (landscape or portrait) and adjust the scale. The PDF paper size will be A4. In the preview pane, you can rotate and print the PDF. The previewed PDF adjusts as you make changes.
There are three aspect ratio options:
Fill
The object is resized to minimize white space on the page. This is the default option when downloading a visualization. This option has the following characteristics:
-
The whole object is scaled to fit the chosen PDF orientation.
-
The sheet or visualization is centered on the page.
-
Chart proportions may or may not be the same as seen in the browser window. The object is resized, to scale, until one side of the page is filled. Any remaining white space on the page is filled in, potentially impacting proportions.
-
Resolution is affected by browser window size. A larger browser window size will result in a PDF with smaller text.
PDF export of a chart using the Fill option

Fit to page
The object is resized, but the proportions remain the same. This option has the following characteristics:
-
The whole object is scaled to fit the chosen PDF orientation.
-
Chart proportions are the same as you see in the browser window.
-
The sheet or visualization is centered on the page.
-
Resolution is affected by browser window size. A larger browser window size will result in a PDF with smaller text.
PDF export of a chart using the Fit to page option

Fixed size
The generated PDF will have pre-defined dimensions. This is the default if you use a small screen or download an entire sheet. This scale option has the following characteristics:
- This option is recommended if you want a PDF with a consistent size, regardless of your device's screen size.
- The whole object is scaled to fit the chosen PDF orientation.
- The sheet or visualization is centered on the page.
- Resolution is not affected by browser window size.
PDF export of a chart using the Fixed size option

Downloading visualizations
Do the following:
-
In the hover menu, click
 Download.
You can also click
 > Download.
 - Select Data, Image, or PDF:
- Data: nothing to configure, with the exception of the straight table. See Downloading a straight table as data.
- Image: use the Details drop down list and select Custom to change width and height.
- PDF:
- Choose either Portrait or Landscape.
- Under Scale, select Fill, Fit to page, or Fixed size.
- Click Download.
Downloading sheets
Do the following:
- Open the sheet you want to download.
- Click in the toolbar and select Download sheet as PDF.
- Choose either Portrait or Landscape.
- Under Scale, you can select Fill, Fit to page, or Fixed size.
- Click Download.
Downloading stories
Do the following:
- Open the story you want to download.
- Click in the toolbar and select Download story as PDF.
Limitations
When downloading application content
Consider the following limitations that apply to downloading application content. These limits are checked when you click Download. If these limits are exceeded, you will see an error message. If this issue occurs, contact a user with Can edit permission in the application.
The specific limitations are listed below:
-
Maximum image size: 4,000 x 4,000 pixels
-
Minimum image size: 5 x 5 pixels for charts and 20 x 20 pixels for sheets
When downloading as image
- Sheet titles cannot be exported as images.
- The following visualizations cannot be downloaded as images:
- Button
- Filter pane
- Navigation menu
- Tab container. You can download compatible objects within a tab container as images.
- Text & image
- Animator
- Existing instances of the legacy container object
- Date range picker
- Variable input
- Video player
- Trellis container
- Third-party extensions are exported as blank images.
- Dynamic view objects are not supported. They are exported as blank images. However, unlike other unsupported chart types, dynamic charts increase download times. A sheet with many dynamic charts might time out and fail to download.
-
When using a custom font in your application, it is assumed you have the required license to use that font in output from Qlik Sense. To ensure your fonts are licensed, make use of the multiple open-source fonts available in Qlik Sense for styling application content.
If you have the required licenses for a font that is not available in the default Qlik Sense themes, see Create themes with custom fonts to learn about adding the font to a custom theme.
- Shadows applied to chart objects are not shown in the output.
When downloading as PDF
-
The following visualizations cannot be downloaded individually as PDFs:
- Button
- Filter pane
- Navigation menu
- Tab container. You can download compatible objects within a tab container as PDFs.
- Text & image
- Animator
- Existing instances of the legacy container object
- Date range picker
- Variable input
- Video player
- Trellis container
Also, the following visualizations are not exported when the entire sheet is downloaded as a PDF:
- Animator
- Date range picker
- Variable input
- Video player
- Trellis container
- Third-party extensions are exported as blank images.
- Dynamic view objects are not supported. They are exported as blank images. However, unlike other unsupported chart types, dynamic charts increase download times. A sheet with many dynamic charts might time out and fail to download.
- There is no preview in the Download dialog if the browser does not have a PDF viewer plugin installed.
-
When using a custom font in your application, it is assumed you have the required license to use that font in output from Qlik Sense. To ensure your fonts are licensed, make use of the multiple open-source fonts available in Qlik Sense for styling application content.
If you have the required licenses for a font that is not available in the default Qlik Sense themes, see Create themes with custom fonts to learn about adding the font to a custom theme.
-
When characters that are unsupported in the selected font are used in application content, these characters will be rendered in output with a font in which they are supported. Different behavior might be noticed if a custom font is used.
-
If you use a custom theme in your application to define font use (for example, adding a font file directly to the theme), fonts rendered in various outputs might not be the same fonts you have used in your application.
- When downloading application content as PDF, shadows applied to chart objects are not shown in the output.
-
For limitations that apply when downloading straight tables as PDFs, see Downloading a straight table as a multi-page PDF.
When downloading stories as PDF
-
Stories download with the following settings:
-
Paper size: A4
-
Resolution: 200 DPI
-
Orientation: Landscape
-
Scale: Fit to page. The Storytelling 16:9 format is kept, resulting in some extra space at the bottom of the PDF.
-
-
When characters that are unsupported in the selected font are used in embedded application content (not the story text elements), these characters will be rendered in the PDF file with a font in which they are supported. Different behavior might be noticed if a custom font is used.
-
The application locale determines the font used in story text elements, not the fonts in chart snapshots. For example:
-
Arial is the default, unless the application locale matches with one of the cases below.
-
WenQuanYi Zen Hei is used for Simplified Chinese (China) and Japanese (Japan), among others.
-
FreeSerif is used for Georgian (Georgia) and Thai (Thailand), among others.
-
- Embedded sheets are downloaded as PDFs in their default state. Changes made to objects in embedded sheets, such as changing the orientation of a bar chart, are not included.
-
The language in text objects in the story should match the language set in the load script for the application system variable CollationLocale. If they differ, text objects in stories might not download as expected.
- When downloading stories as PDF, shadows applied to chart objects are not shown in the output.
When downloading data
- The following visualizations cannot be downloaded as data:
- Button
- Filter pane
- Map
- NL insights
- Navigation menu
- Tab container. You can download the data of compatible objects within a tab container.
- Text & image
- Existing instances of the legacy container object
- Date range picker
- Layout container
- Line control
- Text object
- Variable input
- Video player
- Trellis container
- Dynamic view objects cannot be downloaded as data.
- Box plot, distribution plot and histogram data contain multiple hypercubes that correspond to multiple sheets in the downloaded Microsoft Excel file. When you download data, the default hypercube is only downloaded as a single sheet.
-
When downloading data from a table or pivot table, column- and cell-specific styling is not preserved. Dynamic colors, background colors, and images are not supported in chart data downloads.
-
The Excel file cannot have more than:
- 1,048,566 rows
- 16,384 columns
-
The size of the downloaded Excel file cannot exceed 100 MB. File size will depend on:
-
The number of columns and rows
-
The total amount of cells
-
The amount of text in the cells
The total amount of cells cannot be determined before download.
-
-
In Excel versions of downloaded charts, exported text is not automatically adjusted to a contrasting color if the chart is configured with a Background color expression that uses the colormix1 or colormix2 functions, or dark colors. This limitation applies to Qlik Cloud Analytics.