
Scheduling reports with subscriptions
Subscription reports let you schedule recurring emails containing your preferred sheets or chart. You can set your desired filters and have a report with the newest data delivered to your inbox at a scheduled time. For example, you could receive overnight order information in an email every morning. You can edit subscriptions you own at any time.
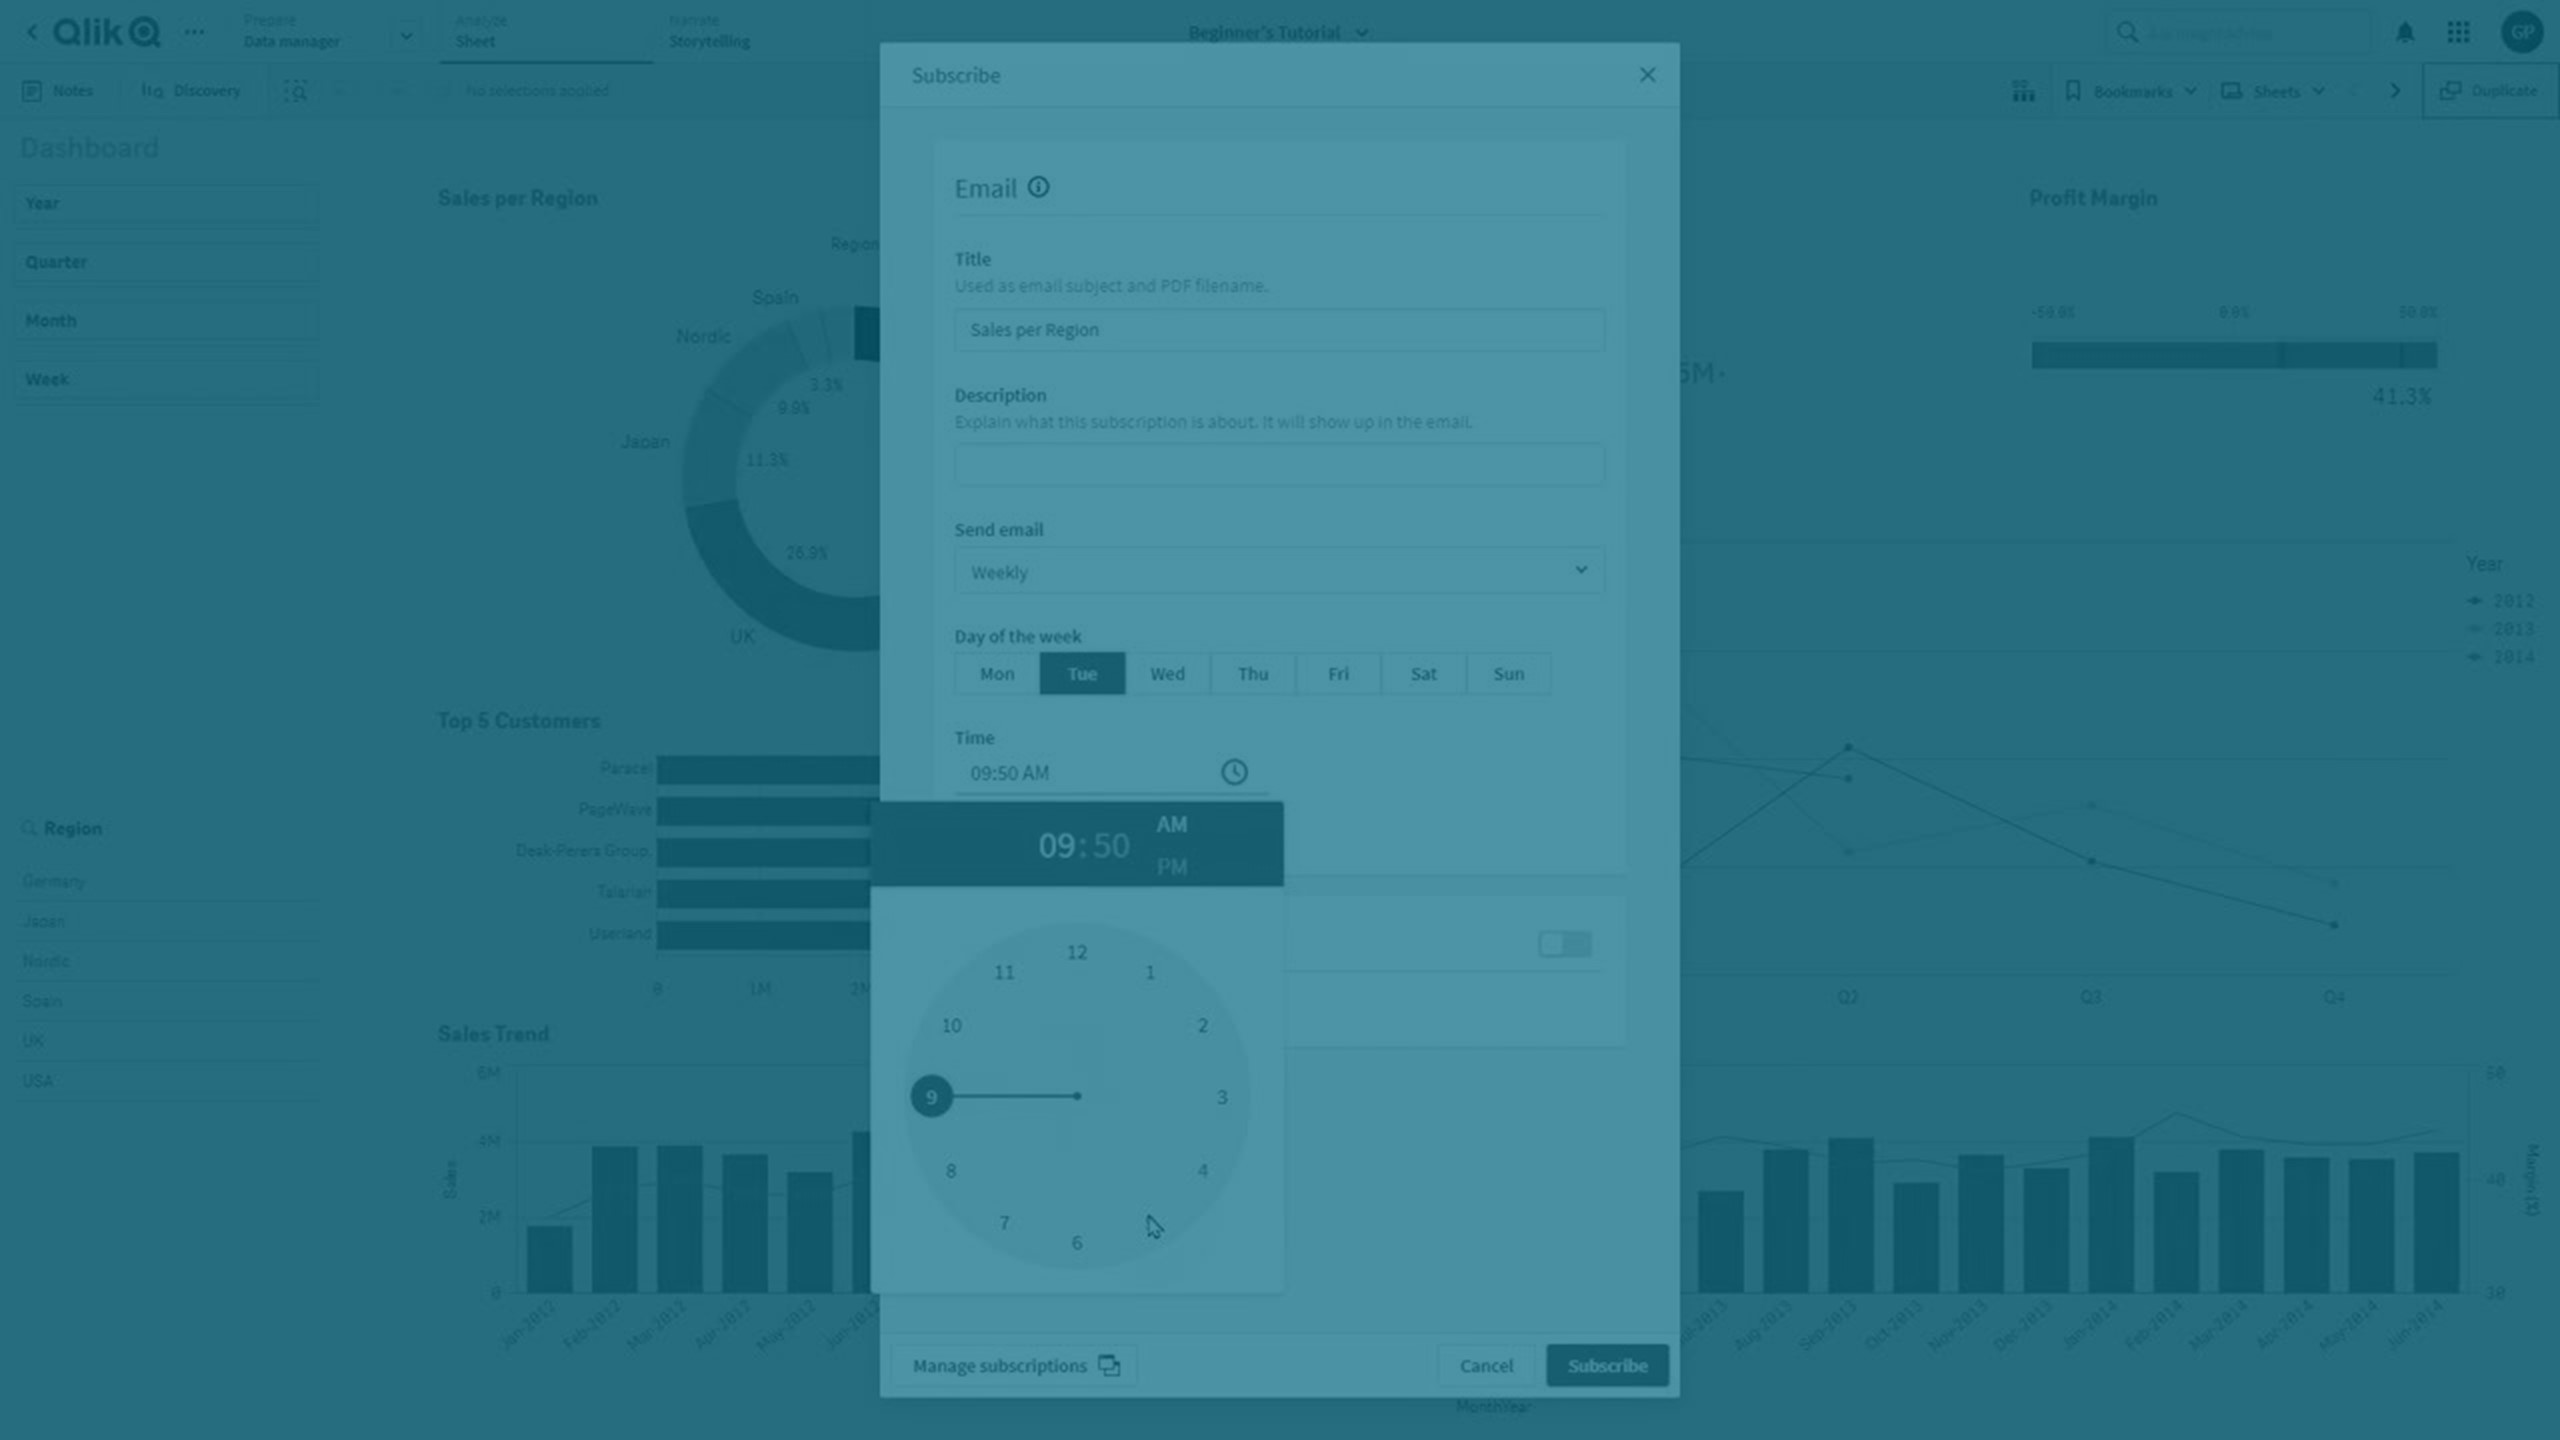
Subscription report delivered via email

Subscriptions follow the same access rules as applications, data, and spaces. Owners and recipients are restricted according to section access, permissions, and user entitlements (Professional and Analyzer). Recipients will only receive data they have access to.
A subscription report email contains:
-
A PDF or PowerPoint file of the subscribed visualization or sheets as an attachment. Image resolution will be 300 DPI.
-
An image of the visualization. There is no image if you subscribe to sheets.
-
A link to the application, so you can see the original point of analysis. If the subscription includes more than one sheet, the first sheet in the list is opened.
-
A link to your subscription management page.
When to use subscriptions
Subscriptions are generated based on the schedule you set. You should create a subscription if:
-
You want regular updates on a chart or up to 10 sheets.
-
You do not need to set up something as mathematically complex as an alert.
-
You want to produce an export of up to 10 sheets or a chart on a schedule.
-
Your recipients have access to Qlik Cloud.
-
Your recipients want to be able to add sheets or charts to PowerPoint files.
Other ways to share data insights
If you want to receive notifications when certain conditions are met in your data, see Monitoring data with alerts. Alerts are evaluated based on data reloads and are sent based on data exceptions. Alerts can also trigger on a schedule, but you still need to create a condition or target to save an alert. You can add Qlik users to an alert.
If you want to generate customizable reports based on an entire application and send them to any recipient, consider using the value-add Qlik Reporting Service capabilities. These include:
-
In-application reporting. Control report generation with task-based or on-demand workflows, available from directly inside your application. For more information, see In-application reporting with Qlik Cloud Analytics.
-
Reporting with Qlik Automate. Create dynamic reports using the no-code automation building blocks. For more information, see Reporting from Qlik Cloud Analytics with Qlik Automate.
-
Direct use of the Qlik Reporting Service API. For more information, see the Developer Portal documentation.
Prerequisites
Subscriptions have the following prerequisites:
- Subscriptions must be turned on by a Qlik Cloud admin. For more information, see Enabling and disabling reporting, subscriptions, and sharing features.
-
You need a valid email address configured in Qlik Cloud.
-
You need to have view permissions for the application in which you are creating subscriptions.
Application settings saved in subscriptions
When you create a subscription, the following settings are saved:
-
Selections
-
Visualization properties: layout, colors, legend, labels, and more. For information on applying these properties, see Visual exploration.
-
JavaScript options: languages, themes, variables, or deviceTypes
DeviceType might be auto, touch, or desktop. The value depends on the touch screen mode toggle in your Qlik Sense application. If touch screen mode is on, the deviceType will be touch. Otherwise it will be auto or desktop.
Handling of selections
Selections saved in your subscription are calculated based on their current value at time of report generation. This allows you to apply expression-based selections for subscriptions that dynamically adjust to current data. For example, you can apply a selection using the expression search =Year=year(now()) so that reports always filter data for the current year.
Handling of other settings
Other saved settings are applied each time the report is generated. For example: you create a subscription in an application that uses Theme1. The application is later changed to Theme2. The subscription report will continue to use Theme1.
Creating a subscription
You can create a subscription based on a visualization or a sheet. When you create a subscription, you become the owner. If you own a subscription, you can add recipients to it. For more information, see Sharing a subscription. If you create a subscription based on a sheet, you can add up to 10 sheets to the subscription.
Do the following:
-
Open the sheet in analysis mode. Do one of the following:
-
Right-click on a visualization, and select Subscribe.
-
On the top bar, click
 , and select Subscribe to sheet.
-
-
Title
Enter a Title for the subscription. This will be used as the email subject.
-
Description
This field is optional. This will appear in the body of the email. This section can be used to differentiate between subscriptions that are similar.
For example: Weekly sales - East coast and Weekly Sales - West coast.
-
Format
Choose between PDF or Microsoft PowerPoint. If your reports are distributed as PowerPoint files, they can be edited by your recipients.
-
Data
Configure the data used by the subscription. Variables in the subscription are handled with bookmark capabilities. Control variable data with the Use variable state setting, which is equivalent to the Save all variable states setting in bookmarks.
Variable states may still be included if the application creator set Include in bookmarks on any variables in their application. For more information, see Including variable states in bookmarks and reports and Creating bookmarks.
By turning the Use variable state setting on, variable values will be included in the bookmark that will be applied when generating reports.
-
Sheets
If you based the subscription on a sheet, you can add more sheets to the subscription. The maximum number of sheets is 10.
You can sort the sheets to change the order they are displayed in the email.
-
Send email
Choose how often the subscription will generate a report. The time you set is when report generation will start, not when the report will be received:
-
Daily: choose what time the report will be generated each day.
-
Weekly: choose which days of the week the report will be sent. You can select as many days as you want.
-
Monthly: choose which days of the month the report will be sent. You can select as many days as you want.
-
-
Time
Choose the time of day the subscription will send a report.
This is the time the report will be added to the queue for generation. It is not the time you will receive the report. To learn about report generation times, see Report emails not arriving when scheduled.
-
Turn on Add users to subscription to add recipients to the subscription.
-
Click Preview to download a copy of the report as a preview. Your current selections in the application are applied in the preview.
-
Click Subscribe.
Sharing a subscription
You can add recipients to a subscription if:
-
You own the subscription.
-
The sheets are public.
-
The recipient has access to the application. If they do not have access, they will be added to the subscription, but they will not receive reports. Once they get permission to access the application, you can edit the subscription and add them.
Recipients do not receive a notification when they are added or removed from a subscription.
Managing your subscriptions
Click Subscriptions in the Analytics activity center to see a list of subscriptions owned by you, as well as subscriptions to which you have been added as a recipient. You can also access Subscriptions from the user profile menu in the upper right-hand corner of the application.
You can filter and sort the subscriptions on the Subscriptions page. You can refine your list by owner (anyone, you, or others), or search for subscriptions owned by a specific user. The subscriptions in the list can be sorted by time last sent, time they are next scheduled to be sent, or alphabetically by name.
Click a subscription to see more details. The ![]() menu to the right of each subscription has several actions.
menu to the right of each subscription has several actions.
If you receive a subscription, but do not own it, you will have the following options:
-
Details: View subscription details such as last sent, scheduled, and created. You can also view a list of all sheets that are included in the subscription and open them in the application.
-
View in app: Open the sheet or chart in the application. If the subscription includes more than one sheet, the first sheet in the list is opened.
-
Unsubscribe: Remove yourself from a subscription.
If you are the subscription owner, you will have the following options:
- Details: View subscription details such as last sent, scheduled, and created. Owners can also use this section to edit, send, enable/disable, or delete the subscription.
-
Recipients: View and edit the recipients list.
-
Edit: Change subscription details or schedule.
-
Send now: Send the report immediately.
-
View in app: Open the sheet or chart in the application. If the subscription includes more than one sheet, the first sheet in the list is opened.
-
Enable/Disable: Turn scheduled emails on and off. You can still send a report using Send now.
-
Delete: Delete the subscription. This cannot be undone.
How timezones are displayed for alerts and subscriptions with recurring schedules
In Qlik Cloud activity centers, the time or timezone displayed will usually match the timezone you have set in your personal settings. One exception is the recurring interval schedule for alerts and subscriptions.
If you look at the Details page for an alert or subscription, you can see the next scheduled run-time under Scheduled. The time under Scheduled will reflect your timezone. If you hover over the ![]() , a tooltip will appear showing how often the subscription or alert is sent.
, a tooltip will appear showing how often the subscription or alert is sent.
This image shows what it looks like when the creator and recipient live in the same timezone:
-
The next scheduled run-time is: April 3, 2023 at 2:15 PM.
-
The dark grey tooltip shows how often the subscription is sent: Every week, Monday and Wednesday, at 2:15 PM.
A subscription details page, as seen by a recipient who is in the same timezone as the creator.

However, the tooltip will show a ![]() if the alert or subscription was created in a different timezone than the recipient. In this case, the schedule will be shown in the timezone the alert or subscription was created.
if the alert or subscription was created in a different timezone than the recipient. In this case, the schedule will be shown in the timezone the alert or subscription was created.
For example, a user in Toronto, Canada (GMT-4) creates a subscription. They add a recipient who lives in Stockholm, Sweden (GMT+2). There is a 6-hour time difference between them. The Swedish recipient checks the details page to find out how often they will receive this subscription. Under Scheduled, the time displayed is in the correct timezone: Stockholm, Sweden. However, if the recipient hovers over the ![]() , the tooltip shows the entire subscription schedule in the Canadian timezone:
, the tooltip shows the entire subscription schedule in the Canadian timezone:
-
The next scheduled run-time is March 13, 2023, 3:30 PM.
-
The dark grey tooltip shows the subscription schedule, but in the Canadian timezone:
 Created in (GMT -4:00) America/Toronto: Every week, Monday, Wednesday, Friday 9:30 AM.
The schedule of a subscription created in Canada, as seen by a recipient in Sweden.

Limitations
-
You can create up to 100 subscriptions.
-
You can include up to 10 sheets.
-
A subscription can have up to 100 recipients.
-
If a subscription fails to generate three times, it will be turned off.
-
If export fails for one or more sheets in the subscription, the report will not be generated. Possible causes:
-
The recipient does not have access to all sheets in the subscription.
-
A sheet has been deleted.
-
-
You cannot subscribe to:
-
Filter pane objects
-
Tab container objects. You can subscribe to objects inside a tab container.
-
Navigation menu objects
-
Animator objects
-
Date range picker objects
-
Variable input control objects
-
Video player objects
-
Existing instances of the legacy Container object. Existing subscriptions to objects inside these containers are still supported.
-
Trellis container objects
- Dynamic charts
- Third-party extensions and action buttons
-
-
This capability is a form of reporting in Qlik Cloud Analytics. Across all forms of reporting, a tenant can make a maximum of 30,000 reporting-related requests per day.
-
When using a custom font in your application, it is assumed you have the required license to use that font in output from Qlik Sense. To ensure your fonts are licensed, make use of the multiple open-source fonts available in Qlik Sense for styling application content.
If you have the required licenses for a font that is not available in the default Qlik Sense themes, see Create themes with custom fonts to learn about adding the font to a custom theme.
-
When characters that are unsupported in the selected font are used in application content, these characters will be rendered in output with a font in which they are supported. Different behavior might be noticed if a custom font is used.
-
If you use a custom theme in your application to define font use (for example, adding a font file directly to the theme), fonts rendered in various outputs might not be the same fonts you have used in your application.
-
Shadows applied to chart objects in the application are not shown in the generated subscription report.
-
The maximum execution time for a subscription is two hours.
Consider the following limitations that apply to subscribing to application content. These limits are checked when you click Subscribe. If these limits are exceeded, you will see an error message. If this issue occurs, contact a user with Can edit permission in the application.
The specific limitations are listed below:
-
Maximum number of sheets in the subscription: 10
-
Maximum image size: 4,000 x 4,000 pixels
-
Minimum image size: 5 x 5 pixels for charts and 20 x 20 pixels for sheets
Troubleshooting
Report emails not arriving when scheduled
A report subscription is set to start at a specific time, but does not arrive in your email inbox until hours later.
Possible cause
The time set in the subscription is the time report generation starts, not the time it arrives in your inbox. The time it takes for a report to generate depends on several factors. Most notably:
-
Number of active Qlik Cloud users
-
Number of active or queued processes: alerts, data reloads, subscriptions
Proposed action
Set your subscription to run at a non-peak time. If you and your recipients start work at 9 AM, set your subscriptions to run at 6 AM.