
You can use the variance waterfall chart (Variance waterfall) to show the variance between two measures over the different values of a dimension.
Information noteVariance waterfall is included as a part of the Visualization bundle. Visualization bundle objects have additional limitations and may not have the same support as other visualizations. For more information, see Visualization bundle.
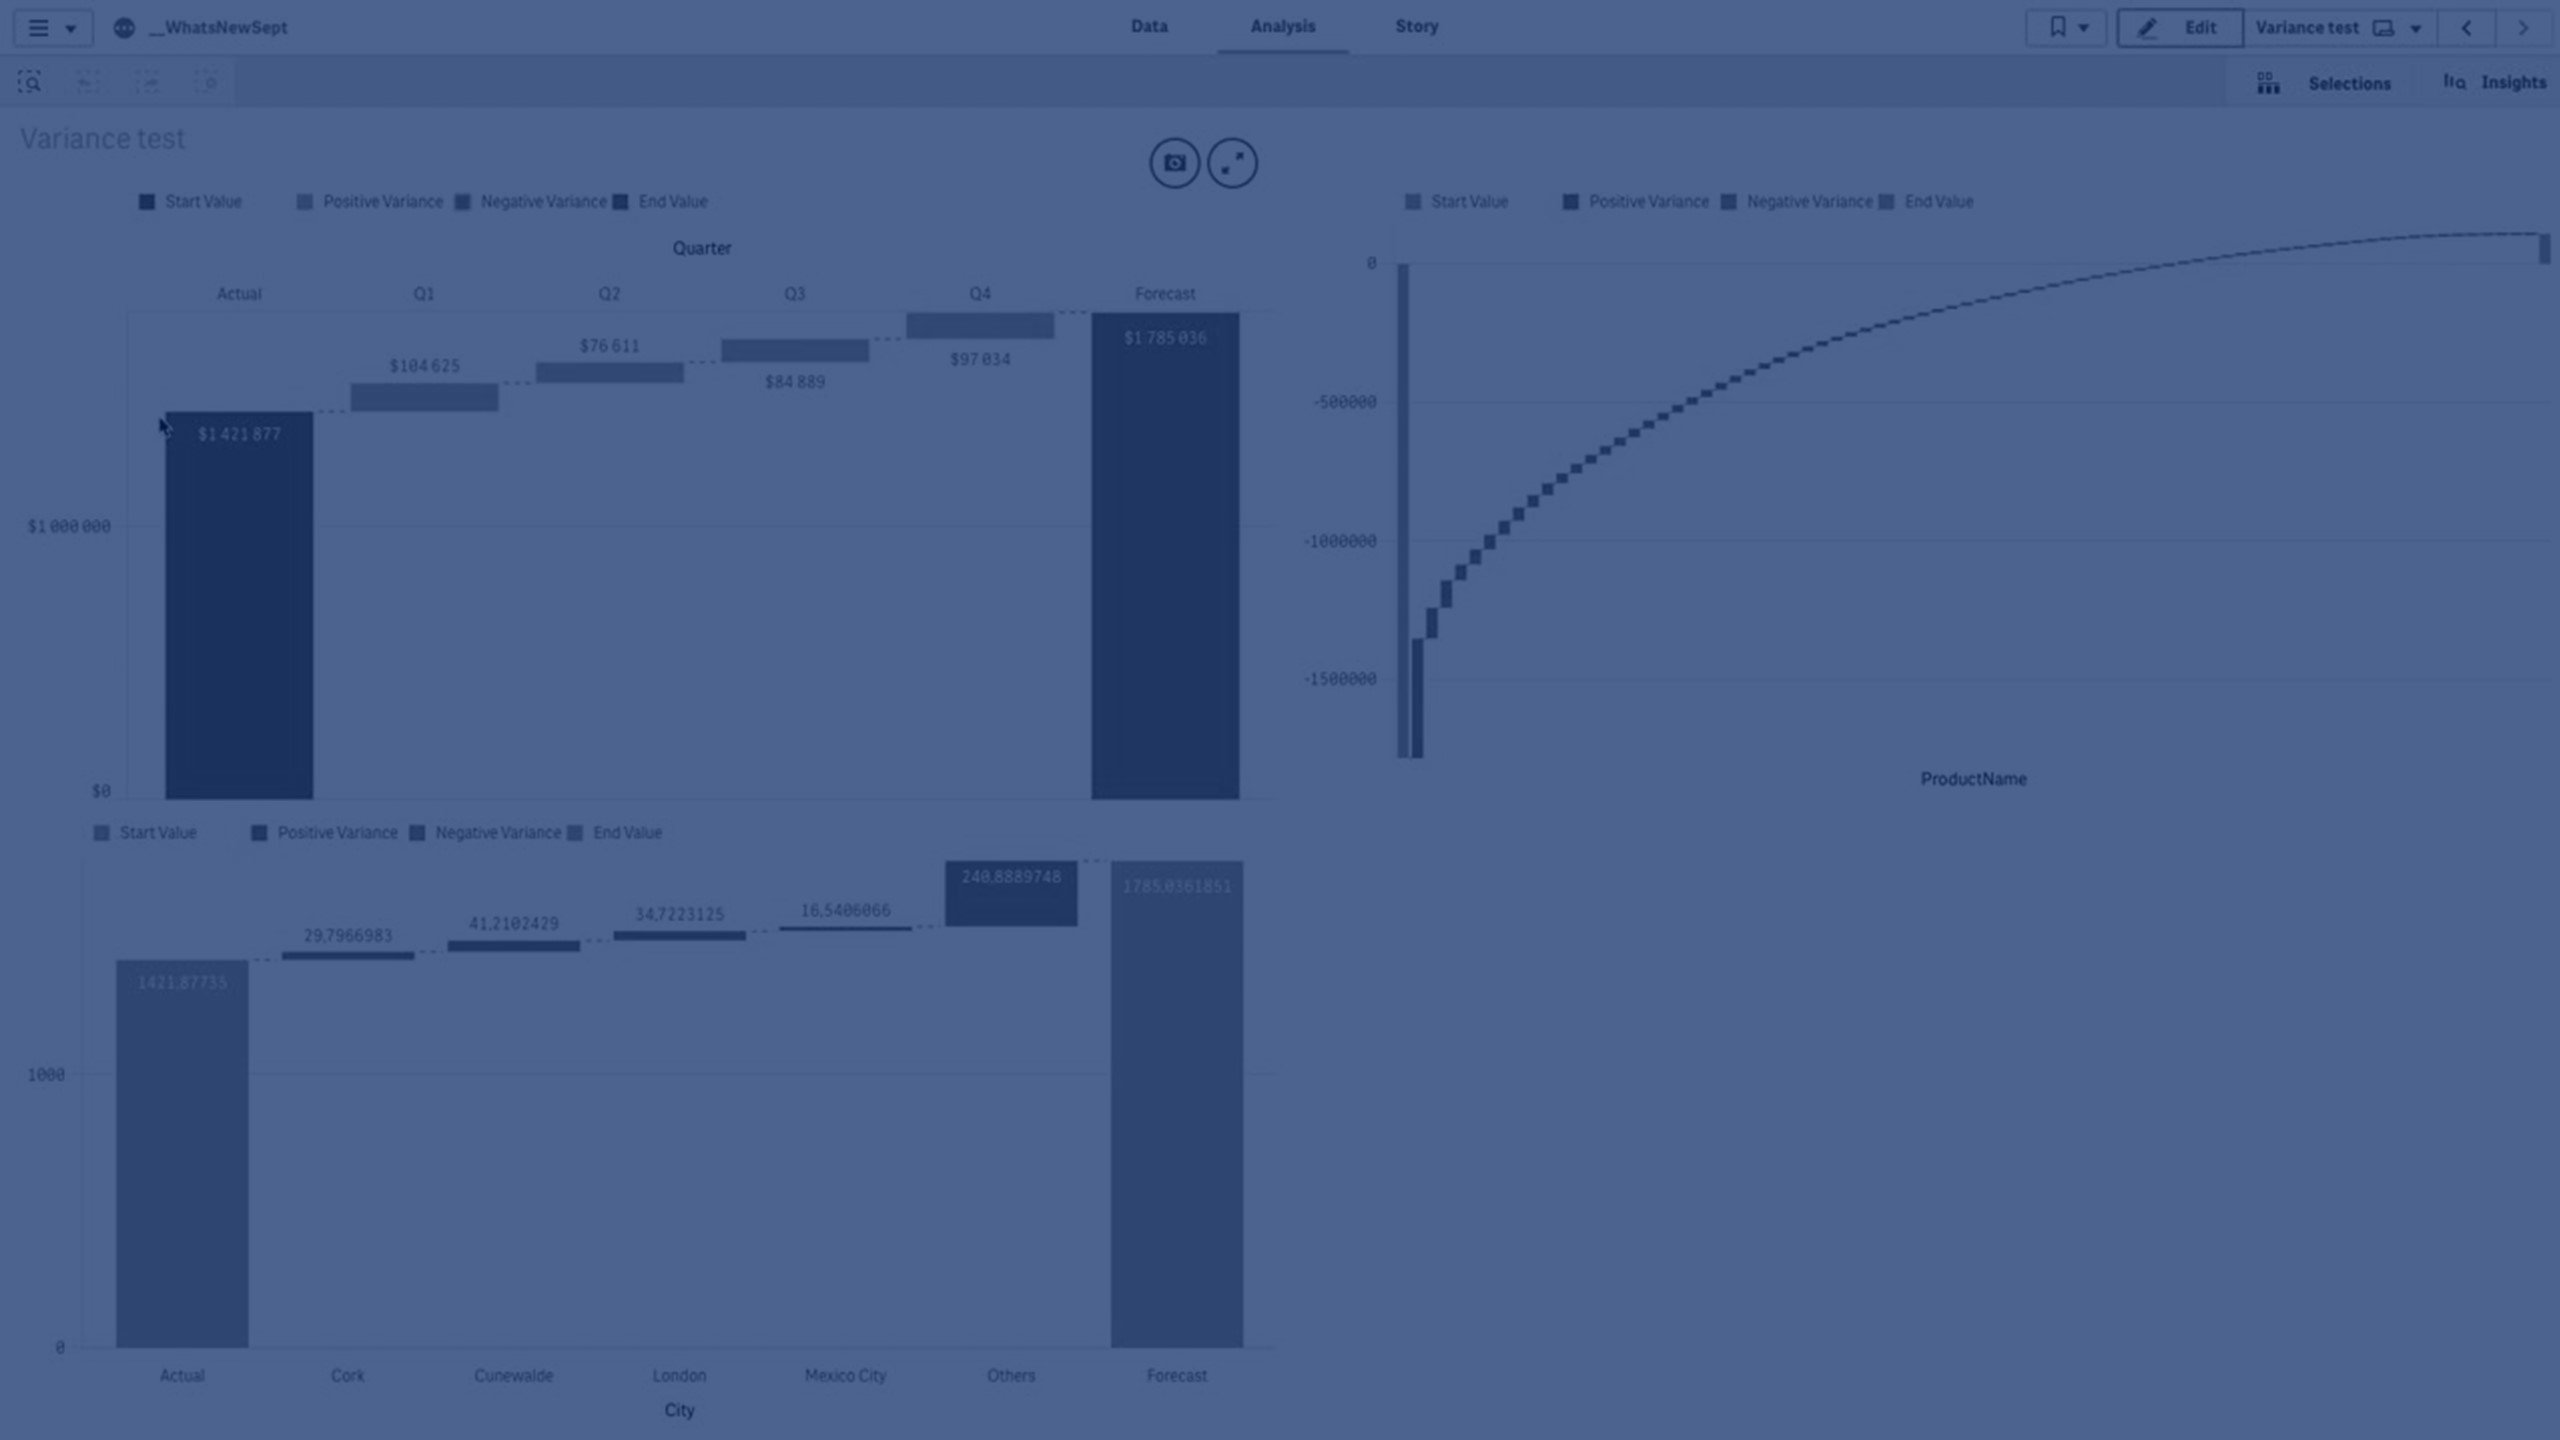
You need to use two measures, start value and end value, and one bridge dimension.
Variance waterfall chart showing spending over fiscal quarters

Limitations
For information about general limitations, see Limitations.
- It is not possible to use a variance waterfall chart in a Trellis container.
- You need to use the same number format for both measures to get correct number format for the dimension variance bars.
Related learning: