The pie chart and the donut chart display the relation between values as well as the relation of a single value to the total. You can use a pie chart when you have a single data series with only positive values. You can use a donut chart when you have a single data series that includes negative values.
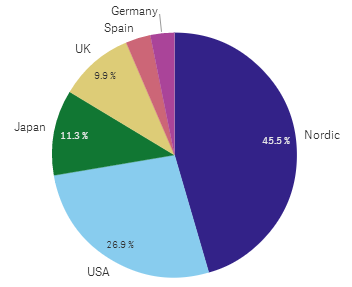
In the pie chart, the dimensions form sectors of the measure values. A pie chart can have one dimension and up to two measures. The first measure is used to determine the angle of each slice in the chart.

Sales per region in a pie chart.

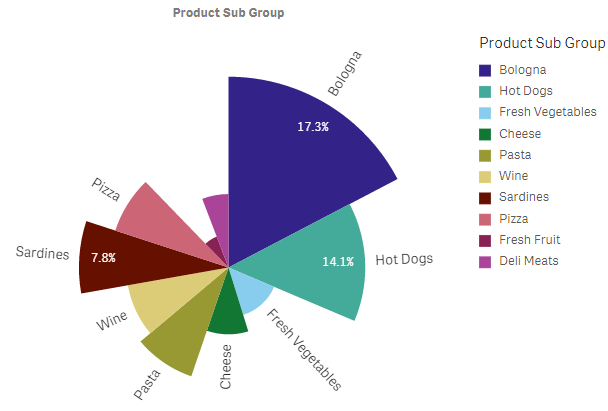
Optionally, a second measure can be used to determine the radius of each pie slice. This style of pie chart is also known as a rose chart.
Sales by product sub group in a pie chart with the average sales per invoice sales determining slice radius

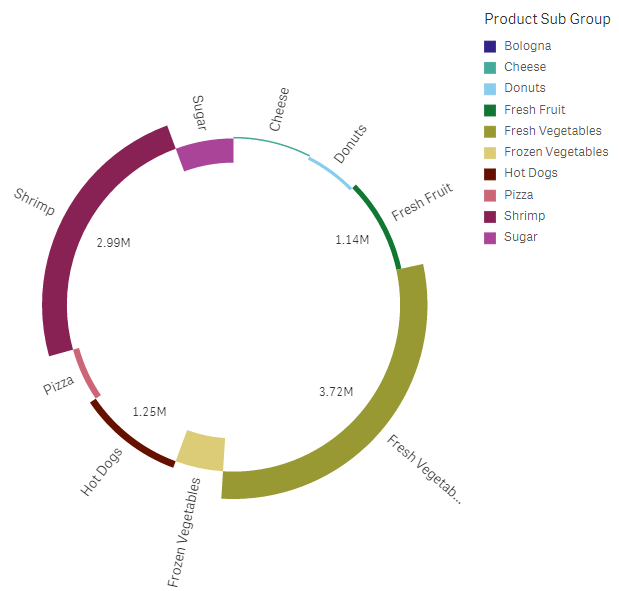
In the pie presentation of the pie chart, negative values in the radius measure are not supported and will be excluded. Negative values in the radius measure are supported in the donut presentation and will point in towards the center of the pie chart.
Sales by product sub group in a pie chart with radius measure containing a comparison of sales from the previous year

When to use the pie chart
The primary use of a pie chart is to compare a certain sector to the total. The pie chart is particularly useful when there are only two sectors, for example yes/no or queued/finished.
We do not recommend that you compare the results of two pie charts with each other.
Advantages
The pie chart provides an instant understanding of proportions when few sectors are used as dimensions. When you use 10 sectors, or less, the pie chart keeps its visual efficiency.
Disadvantages
It may be difficult to compare different sectors of a pie chart, especially a chart with many sectors.
The pie chart takes up a lot of space in relation to the values it visualizes.
Limitations
When coloring by dimension is used in this chart, a maximum of 100 unique dimension values and 100 unique colors can be plotted on the legend.
