
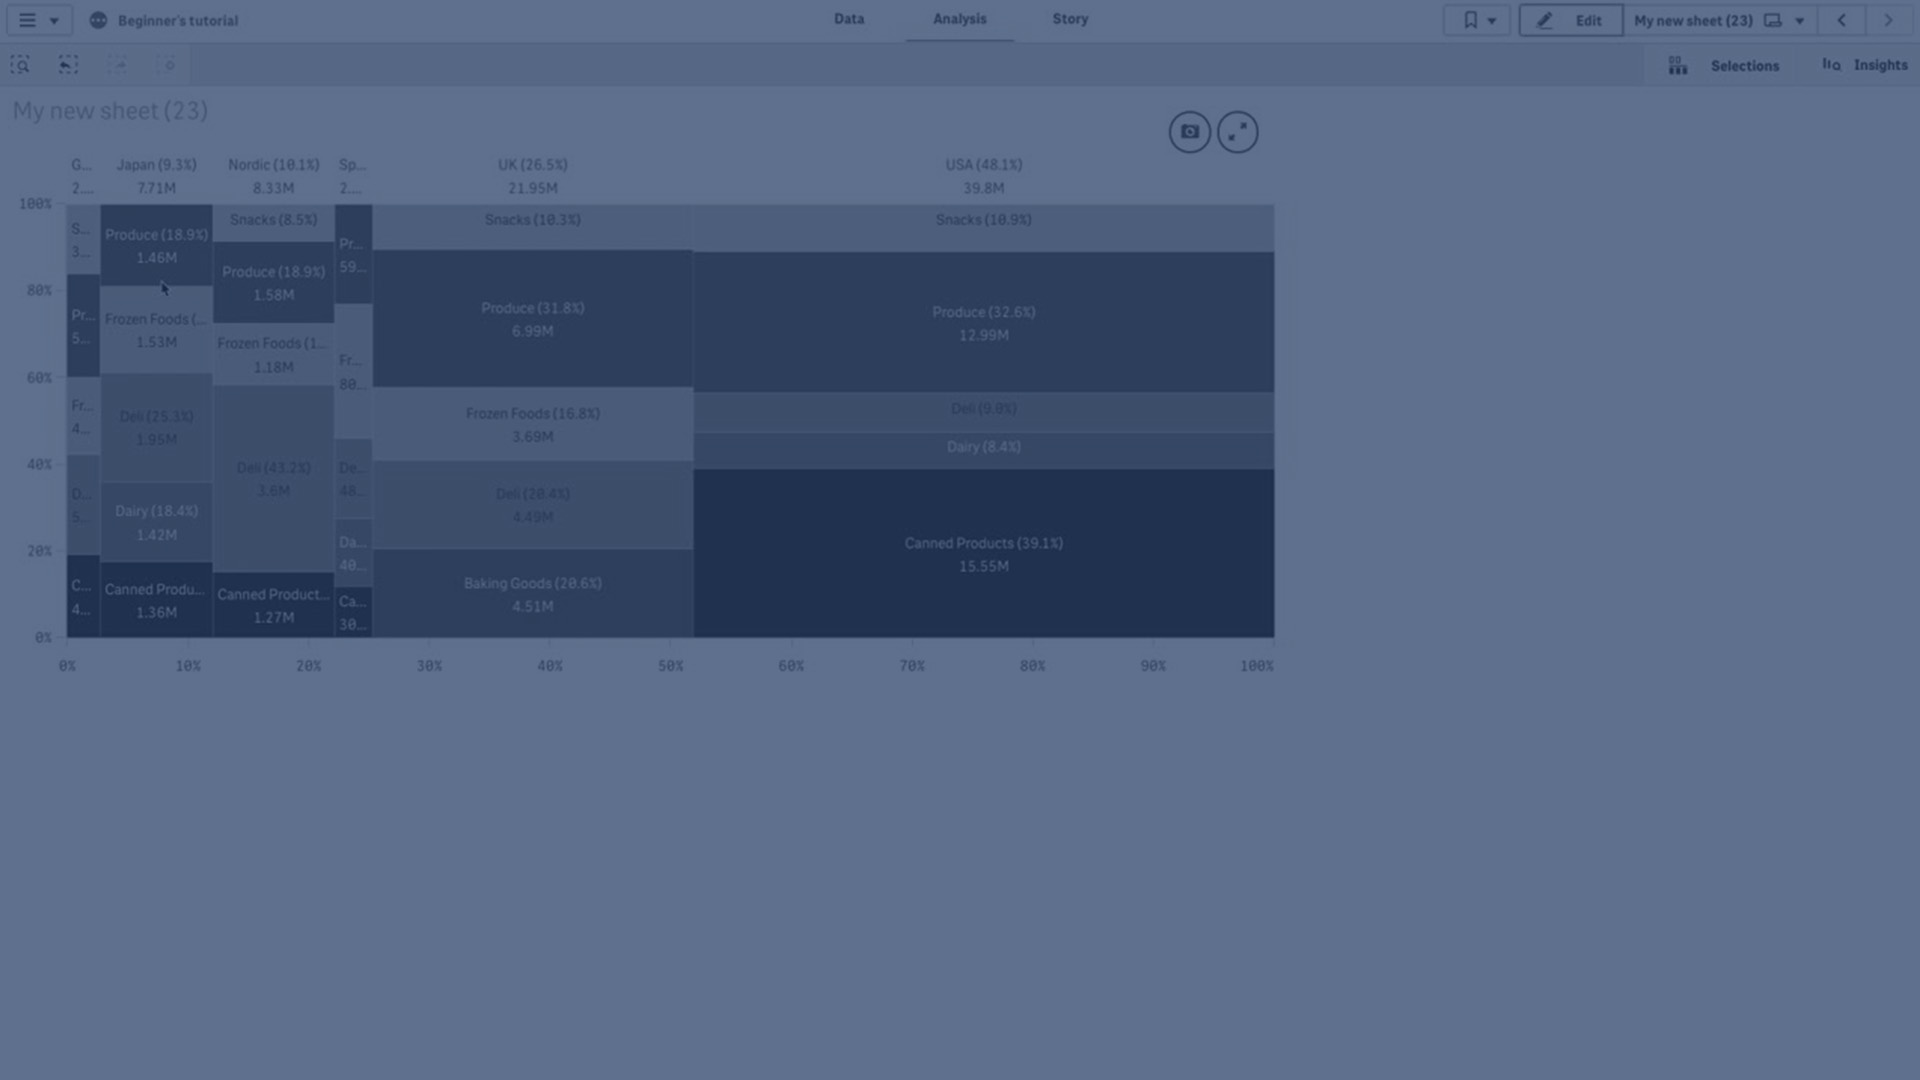
The mekko chart is suitable for comparing groups, while being able to compare category items contained within these groups. Mekko charts are also known as mosaic plots, Marimekko charts, and Mondrian diagrams. The dimension axis shows the groups, while the measure axis shows the normalized percentage value for each category item. The size of each group shows its value.
In this image, the dimensional groups represent different yearly quarters. The width of each quarter shows the normalized percentage value of the sum of sales, for that quarter. Each quarter is divided in several product categories, such as Produce, Canned Products, and Frozen Foods. The height of each product category corresponds to the normalized percentage value of the sum of sales of that product category, within that quarter. This allows you to easily compare between product categories inside a specific quarter, and between different quarters.

Sorting is automatic according to size. By default, the coloring is by dimension, with 12 colors, but that can be changed in the properties panel. You can decide which dimension to color by. In this example, the coloring is by product category to clearly distinguish the different categories and how their contribution to the sales change in each quarter.
If the data set contains negative values, a text message is shown stating that the negative values cannot be displayed.
When to use the mekko chart
Use a mekko chart when you need to visualize normalized percentage values of grouped data. Mekko charts should primarily be used with values that can be aggregated.
Advantages
The mekko chart is easy to read and understand. You get a good comparison between groups, and a comparison of the impact of categories within each group.
Disadvantages
The mekko chart does not work so well with many dimension values due to the limitation of the axis length.
Mekko charts are not good when there is a big difference in the magnitude of the measure values. Nor is a mekko chart the right choice when mixing absolute and relative values.
Negative values cannot be displayed in mekko charts.
Limitations
When coloring by dimension is used in this chart, a maximum of 100 unique dimension values and 100 unique colors can be plotted on the legend.