Creating visualizations with Insight Advisor
Explore your data and create visualizations with Insight Advisor Analysis Types and Insight Advisor Search. Insight Advisor creates visualizations for you using the Qlik cognitive engine and your app logical model. Click in a sheet to use Insight Advisor Search and Insight Advisor Analysis Types.
Insight Advisor is not available when a tenant is using the Qlik Answers agentic experience. Use Qlik Answers instead to explore your application's data and create sheets and charts. For more information, see Qlik Answers.

Insight Advisor Analysis Types
Select the type of analysis you want to see, such as breakdown, trend over time, or mutual information. Then select the data you want used in the analysis. Insight Advisor generates charts using your choices. Insight Advisor Analysis Types is the fastest way to create charts when you know what you want to see and the data sources to use, but not how to build the analysis yourself.
Creating analyses by selecting analysis types
Insight Advisor Search
Enter a natural language question or statement. Insight Advisor then uses the Qlik cognitive engine to interpret your question and create visualizations to answer your questions from your data model. Insight Advisor Search is the fastest way to create charts when you have a specific question to answer.
You can also select fields and master items from the assets panel. Insight Advisor generates results based on your selections.
Creating analyses using search
Creating analyses by asset selection
You can also access Insight Advisor in the Insights and Analytics activity centers with Insight Advisor Chat. For more information, see Exploring apps with conversational analytics.
Insight Advisor and the logical model
Insight Advisor creates visualizations using the Qlik cognitive engine and a logical model of your data. The logical model defines how fields in your data model should be used a dimensions or measures, as well as the relationships between fields. By default, Insight Advisor builds a logical model by learning from user interactions. If you add charts to sheets or edit charts, Insight Advisor learns these preferences.
You can also create your own custom logical model for the app. Business logic lets you to define the relationship and use of data in your logical model. When business logic is turned on, precedent-based learning is not available. If you define calendar periods and set them as default periods, period analysis and period performance analysis types are available. For more information, see Customizing logical models for Insight Advisor.
Creating visualizations with Insight Advisor Analysis Types and Insight Advisor Search
You can generate charts using Insight Advisor in three ways:
-
Select the type of analysis you want to see and the fields or master items that should be used with it. Insight Advisor Analysis Types then generates matching analyses .
-
Ask Insight Advisor a question and let Insight Advisor Search generate charts using natural language analytics.
-
Select fields or master items and let Insight Advisor Search generate charts through auto-analysis of your data.
The data assets available to you in Insight Advisor depend on if the app uses business logic to define its logical model and your space permission. If you have Can view permission will only be able to see master items, unless the app defines its logical model with business logic.
Creating analyses by selecting analysis types
Pick an analysis type and then add fields to create analyses with Insight Advisor Analysis Types. This is a fastest method of creating visualizations when you know what analyses you want to see and the data you want to use, but not how to build the analyses yourself.
Click Create an analysis on the Insight Advisor start page. In Analysis options, all available analysis types display with descriptions of their use.
Analysis options
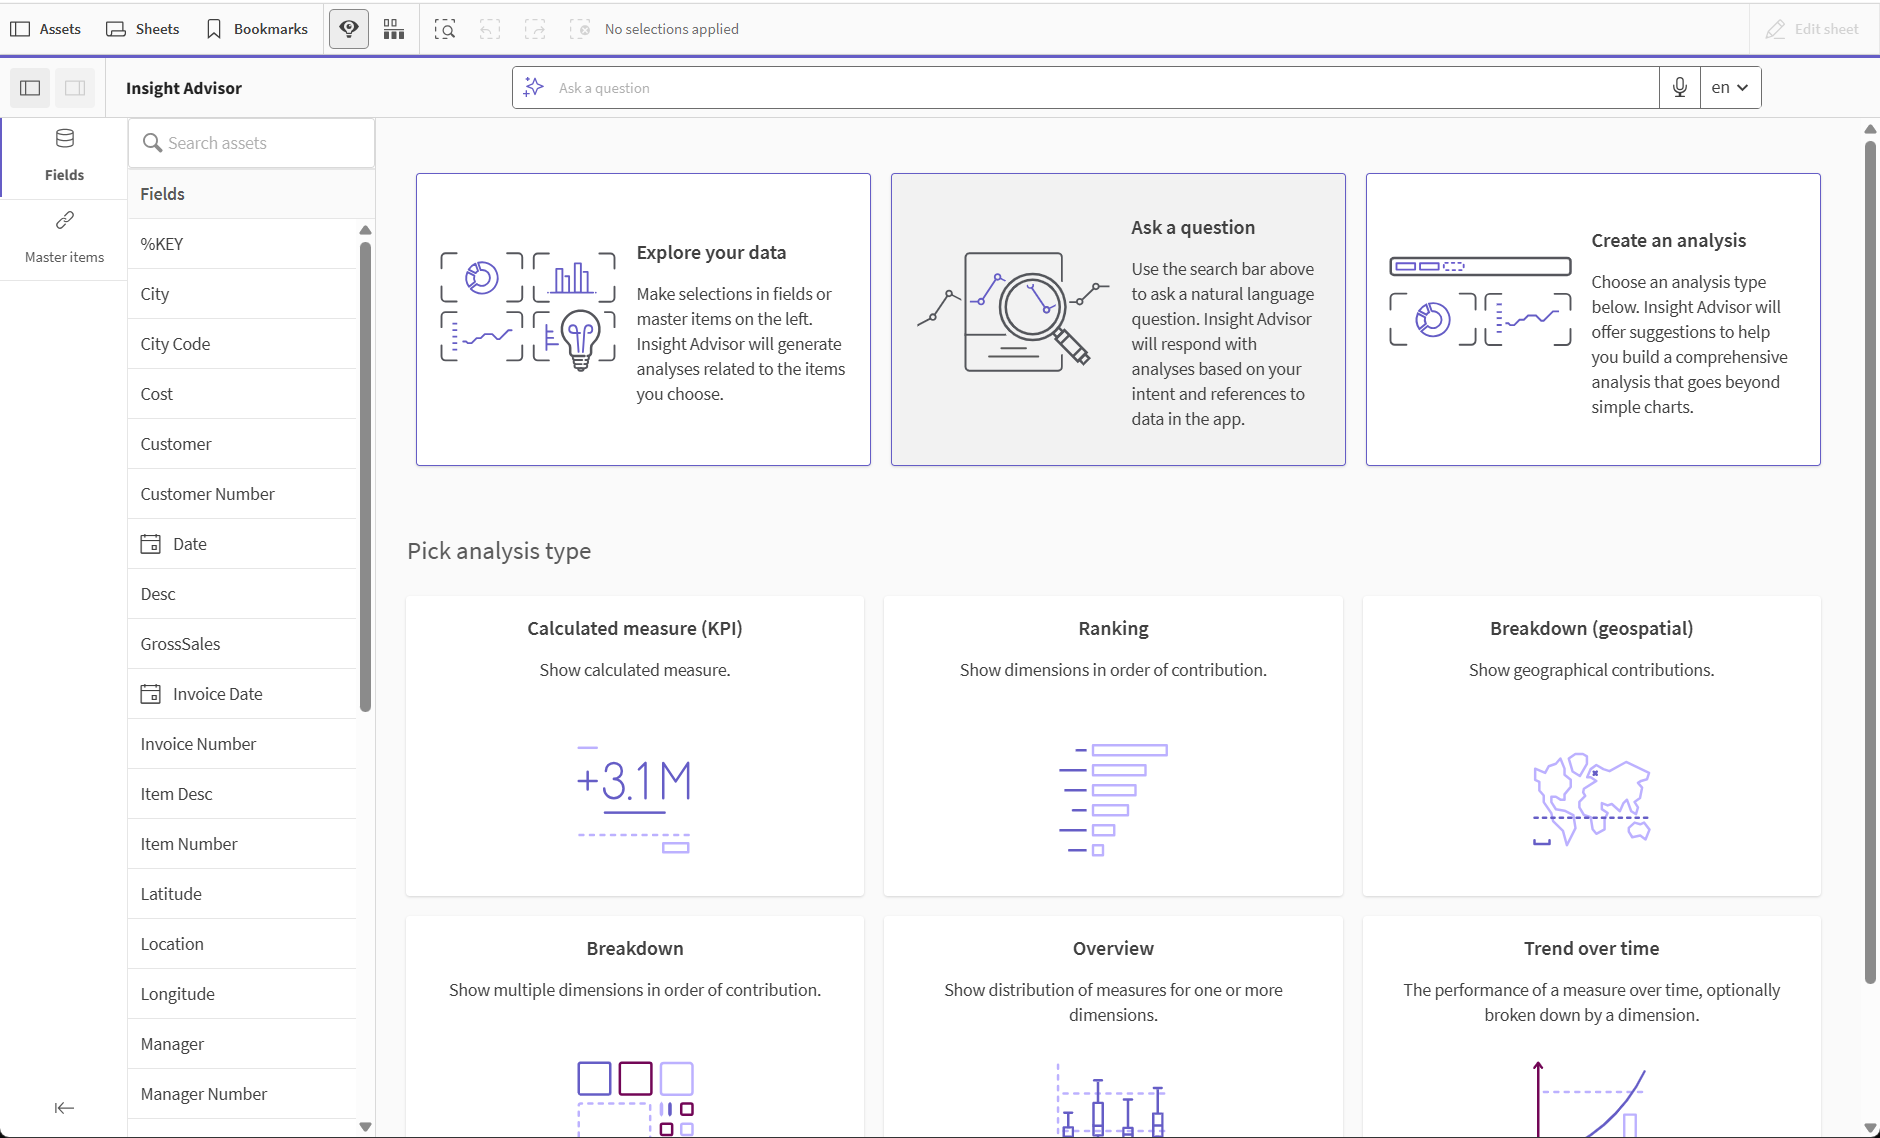
After selecting an analysis type, you then select fields or master items to use in the analysis. Insight Advisor offers suggestions of assets to use for each parameter. You can change analysis types by selecting a new analysis type from the dropdown or clicking View all analyses to view the analysis options. You can clear your selections by clicking Reset analysis.
Building an analysis
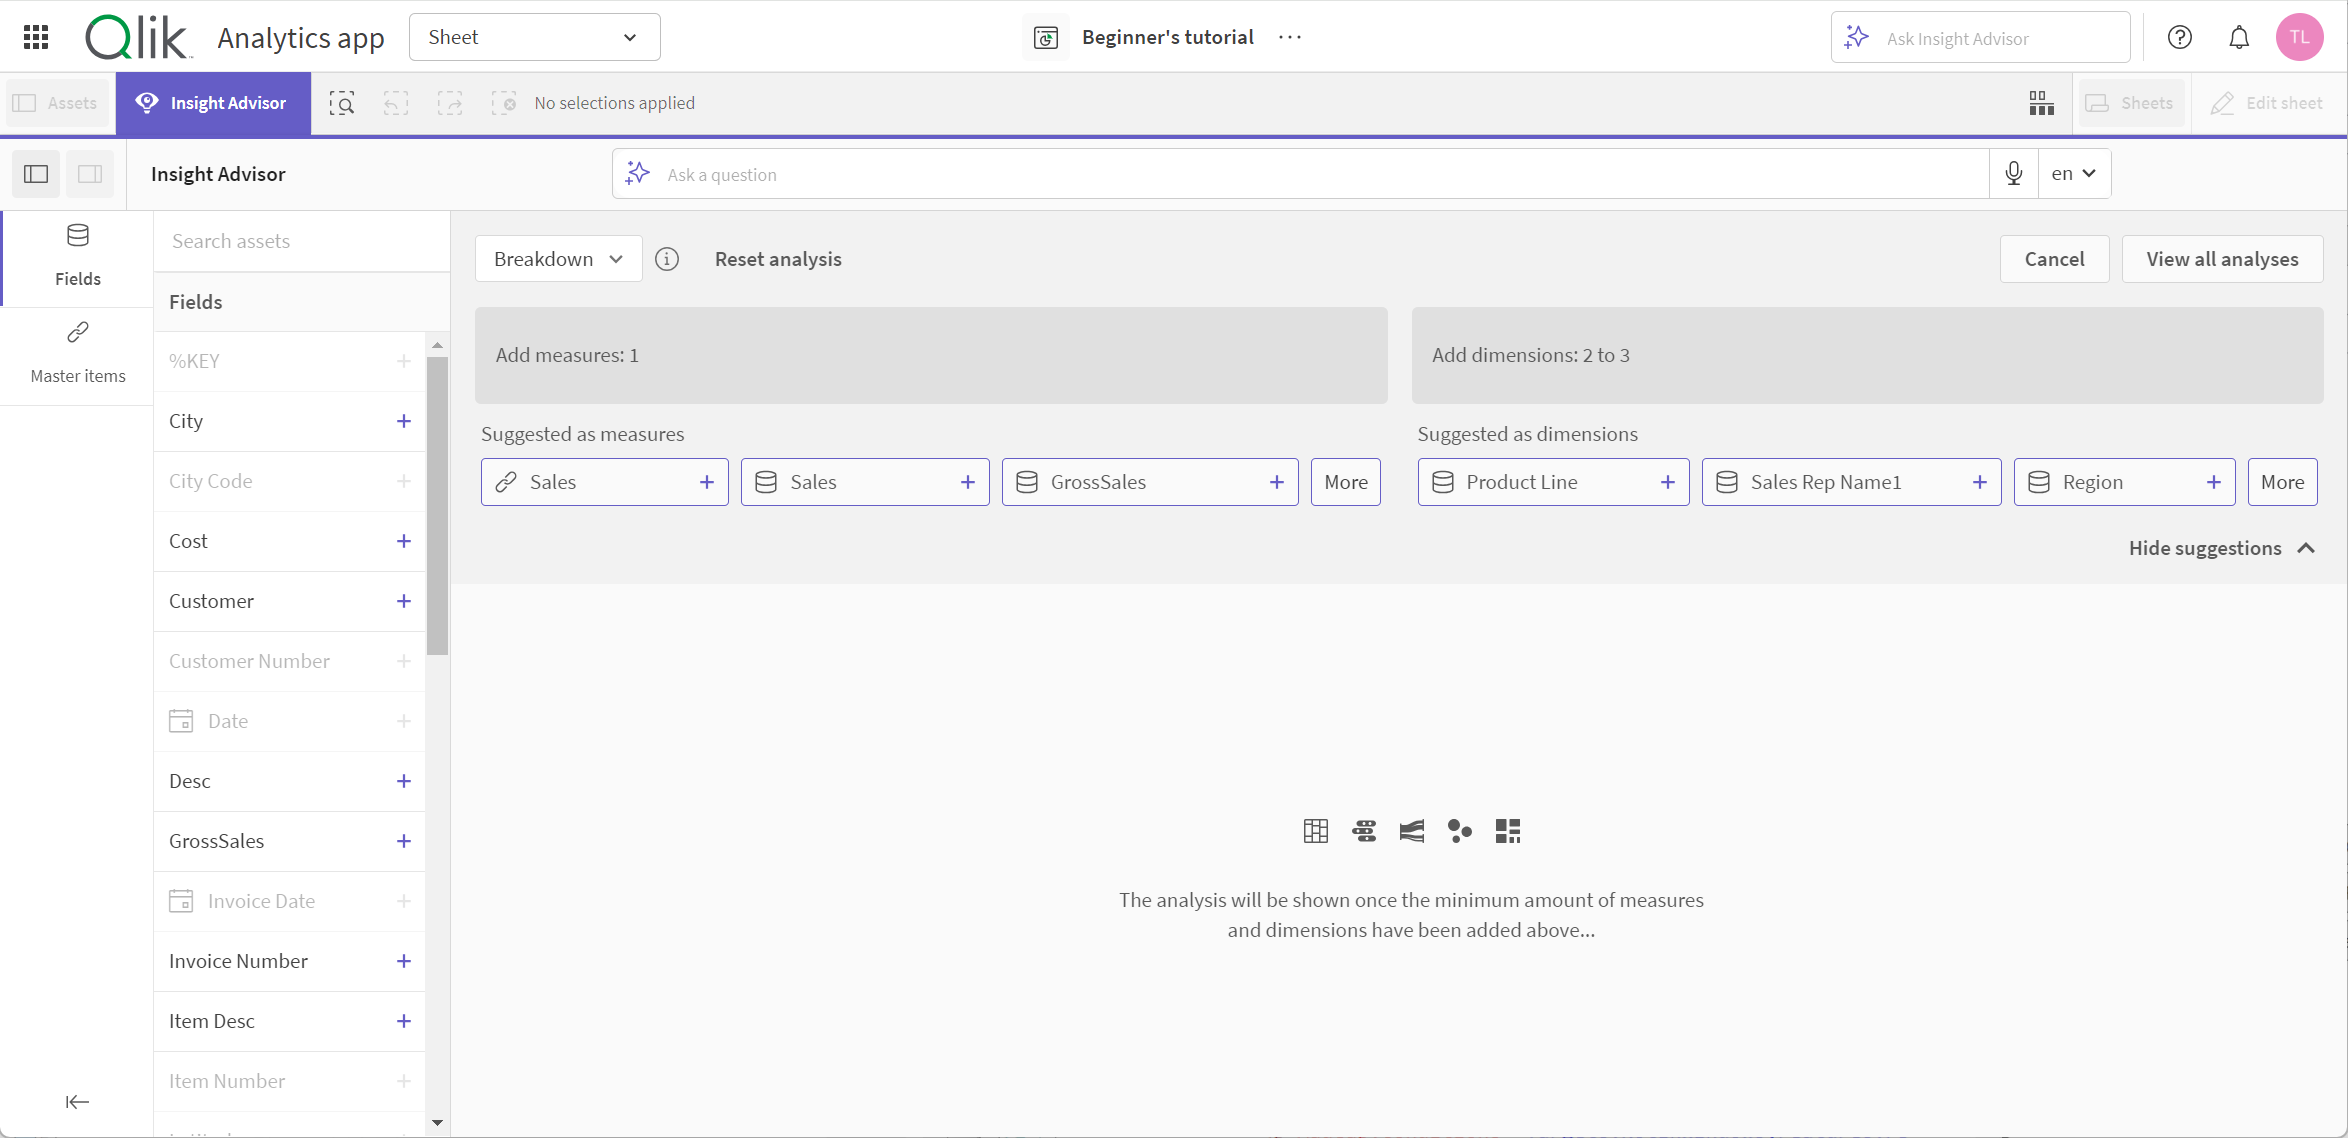
Do the following:
-
In a sheet, click
.
-
Click Create an analysis.
-
Under Analysis options, select your analysis type.
-
Add the required fields or master items for your analysis type.
When you have added the required fields, Insight Advisor generates your charts.
Creating analyses using search
Ask Insight Advisor Search natural language questions and it generates relevant charts using field names, field values, and master items. You can search Insight Advisor in the following ways:
-
Enter a natural language question or statement, such as what are the top products for sales or Show me Product by Revenue in Sweden. Natural language questions work best when they refer to field or master items directly.
For guidelines on using natural language in your searches, see Using natural language with Insight Advisor.
-
For information about language support in Insight Advisor Search, see Supported languages.
-
Select a question from the example questions. App creators may add example questions to Insight Advisor to help guide your analysis. When available, example questions are displayed when you select the search box. For more information on example questions, see Adding example questions to Insight Advisor.
-
If your browser's voice-to-text capability is supported in Insight Advisor, you can click the microphone icon to ask Insight Advisor your question.
Information noteWhen using voice-to-text for natural language questions, your Insight Advisor language should match the language used in your data.
If an app defines time periods in the load script, logical model, or autocalendar, you can ask Insight Advisor for time period comparisons. You can ask for months, quarters, and years in comparisons. To ask for a comparison, use vs, over, against, or compare to in your question. For example:
-
Sales for 2021 vs 2022
-
Sales for 2021 over 2022
-
Sales for 2021 against 2022
-
Compare sales for 2021 to 2022
-
Sales for 2021 compare to 2022
Insight Advisor uses the fields or terms you specify. It may use additional fields in the generated visualizations. Insight Advisor uses any precedents you have given it for hiding charts, setting fields as dimensions or measures, or excluding fields from analysis.
For natural language questions, Insight Advisor tries to find a matching Insight chart result. If one is found, it shows related results as well. You can click to view how Insight Advisor generated results from your question. If you have a matching result, Insight Advisor may provide additional natural language insights relating to your questions. Click Show additional insights to view natural language insights.
Matching result with natural language insights
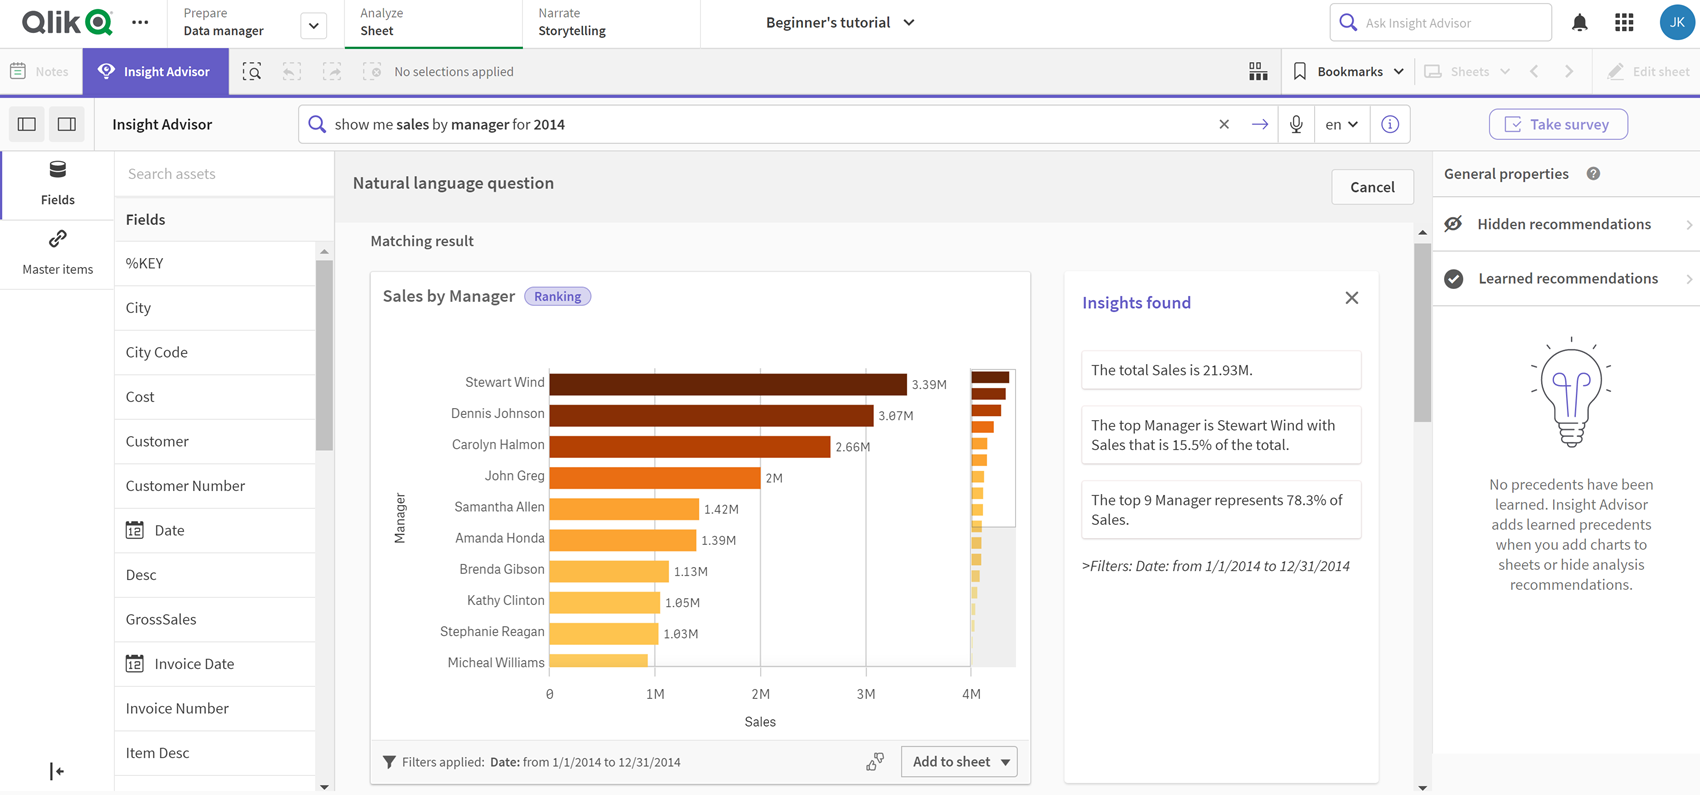
Do the following:
-
In a sheet, enter a question or statement in the Ask Insight Advisor search bar and click
.
Creating analyses by asset selection
Select fields and master items to use in charts and let Insight Advisor Search auto-generate charts, select assets to use from the assets panel. You can also enter asset names in the Insight Advisor search bar. Insight Advisor then uses the fields you selected to generate charts. It may use additional fields in the generated visualizations.
Insight Advisor uses any precedents you have given it for hiding charts, setting fields as dimensions or measures, or excluding fields from analysis.
Insight Advisor analyses generated by selection
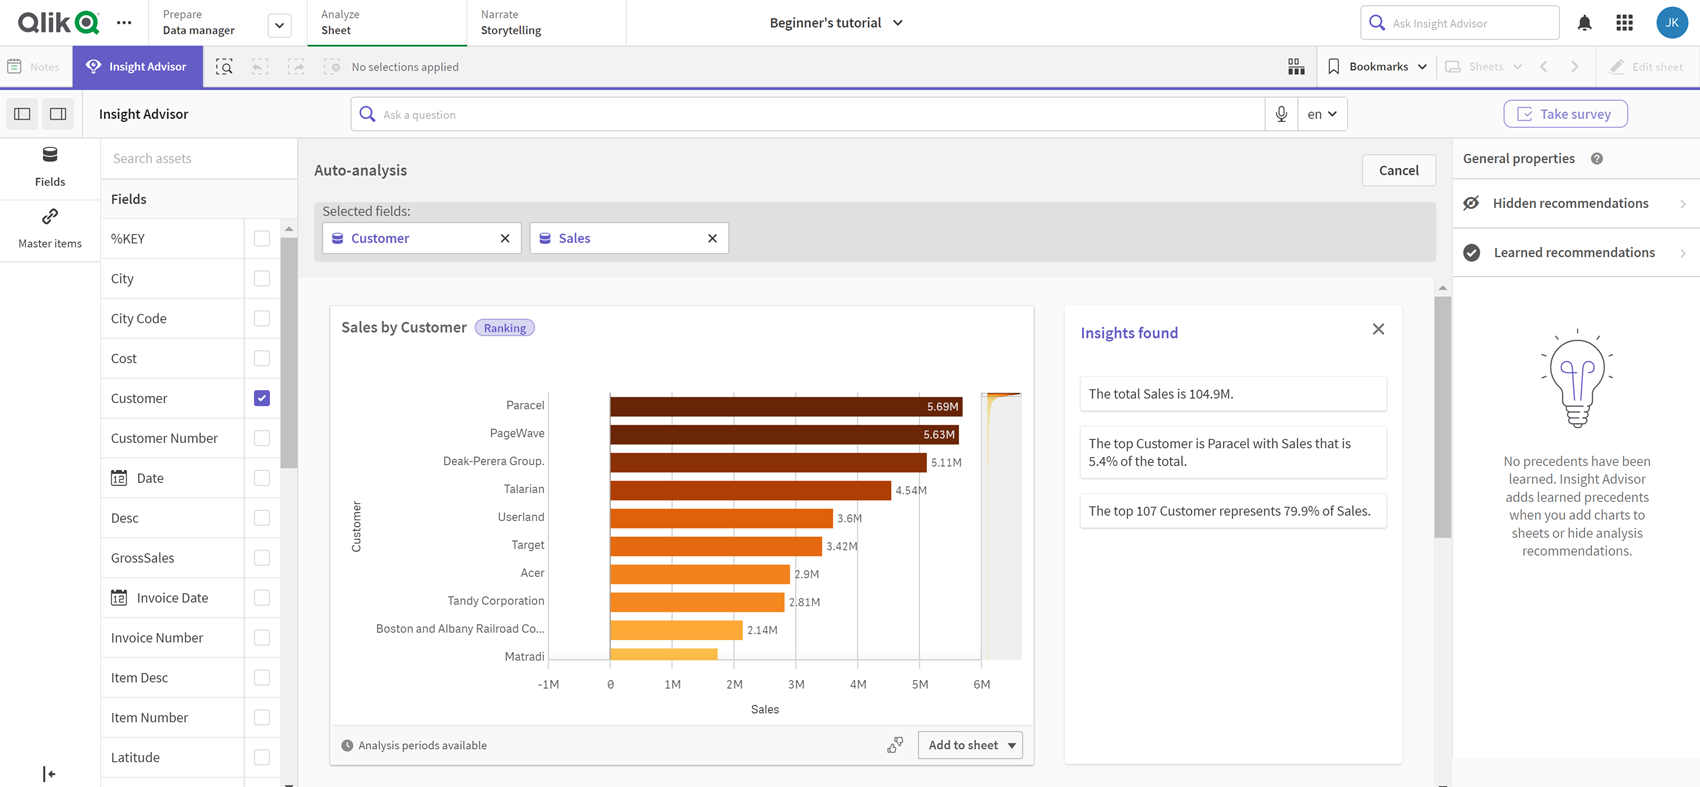
Do the following:
-
In a sheet, click
.
-
In the assets panel, select fields and master items to create analyses.
Alternatively, enter field or master item names in the search bar.
As you select assets, Insight Advisor generates visualizations.
Voice-to-text data transfer considerations
In many internet browsers, Insight Advisor voice-to-text search functionality uses the Web Speech API for external processing of voice-to-text data. This is used by both Insight Advisor Search and Insight Advisor Chat. The user’s internet browser may send the audio recorded by the browser API to an external source for transcription. Voice processing will be handled by the web service chosen by the user’s web browser. As a result, the captured information could be sent to a third-party server. The data is therefore not guaranteed to stay within the user’s Qlik region. Qlik is not responsible for the data processing by this third-party.
If users want to restrict this information flow to their relevant third-party browser (turn off the voice-to-text feature), this might be achieved through specific controls, including settings within their browser of choice and other security configurations.
Using Insight Advisor analyses
You can expand an Insight Advisor analysis by selecting it or clicking . You can then make selections in the analysis.
Note the following regarding selections:
-
Selections apply to all analyses.
-
Selections made in charts from your sheets are kept when you open Insight Advisor.
-
Selections do not affect the charts created by Insight Advisor.
If an analysis is new, you can add it to your sheets. If the chart exists in a sheet, you can click the sheet name at the bottom of the chart to go to that sheet.
Some analysis types, such as period over period dashboard, provide multiple related visualizations rather than a single chart. These show a preview of the kind of visualizations included in the analysis. Click Open analysis to view the analysis with data.
A period over period dashboard analysis
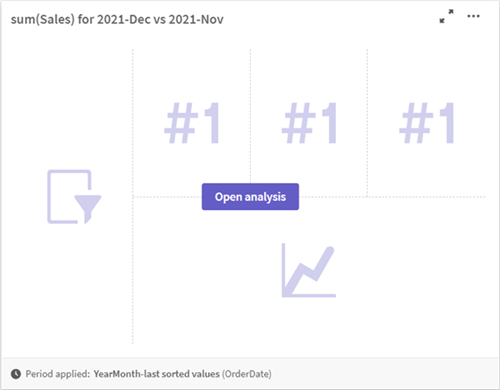
You can view additional options by clicking . The following options are available:
- Full screen: Expand a chart to make selection.
-
Edit analysis properties: Edit the chart properties to change dimensions, measures, and the chart type.
-
Key driver analysis: Configure a key driver analysis using a measure or compatible dimension defined that exists in the recommendation. Add other dimensions and measures as features to compare their relative influence on the target.
Uncovering the key influencers behind your data using key driver analysis
- Add to sheet...: Add the chart to a new or existing sheet.
- Add to new sheet: Add the charts to a new sheet (period changes, period changes (detailed), period over period, period over period (selected) analysis types only).
-
Monitor in activity centers: Add the chart to your activity centers.
-
Download: Download the chart as an image or PDF.
-
Hide: Hide charts that you do not want Insight Advisor to use again. You can view the charts hidden from your current search in General properties.
Information noteHide is not available in apps using business logic.
Editing Insight Advisor analysis properties
Edit Insight Advisor analysis by selecting a chart and clicking . The following properties are available in Analysis properties:
- Chart type: If available, select a different chart type. For an outline of the alternate chart types available for the different analyses, see Insight Advisor analysis types.
-
Favorable trend: (Rank analysis only) Indicate if the favorable trend for ranking is to increase or decrease.
-
Parameters: Make adjustments to parameters specific to the analysis type of the chart.
-
Dimensions and Measures: Change the fields used as Dimensions or as Measures. You can change the measure aggregation. Reorder measures or dimensions by dragging them.
Dimensions and measures from Insight Advisor analysis can be added to your master items. Click a dimension or measure and then click Add new.
If you specified filters in a natural language question, such as specific field values, you can modify them as well.
-
Details: View information about why the chart was generated and the precedents Insight Advisor has learned from a chart. Select details by clicking them to change or reject them. You can set fields as dimensions or measures or exclude fields from future analysis. You can hide charts from future analysis by selecting We suggested a chart for this combination of data and clicking Hide this chart.
-
Analysis period: Change which period from business logic calendar periods is applied to the chart. You can adjust the analysis period by selecting new values from Period 1 or Period 2.
Select an analysis period for rank type charts to view period and period performance analysis types.
Information noteAnalysis period is only available when business logic is turned on and calendar periods have been created for the app. If there is no business logic, Analysis period is available if the app has date/time fields with autoCalendar derivations in the load script.
Editing calendar period Insight Advisor analyses
If a default calendar period is assigned to a group, additional period analysis types are available for Insight Advisor analysis. Default calendar periods are created in business logic. These have different properties than other charts. The following types are available:
-
Period changes: Shows the change of a measure from the current or latest period in the selected analysis period.
-
Period changes (detailed): Compares a change in a measure from the current period to the previous period. The change is measured using a forecasted target value. You define the percentages for meeting the target, almost meeting the target, and missing the target.
-
Period over period: Compares a change in a measure of the current period versus the previous period.
-
Period over period (detailed): Compares changes in a measure over time between periods. It includes a filter pane for exploring dimension values period over period.
These analysis types have unique properties. Period changes and Period over period (detailed) have the following properties:
-
Breakdown: Select the dimension to use with the measure to view the period changes.
-
Measures: Select the measure for which you want to see period changes.
-
Analysis period: Select the analysis period. You can adjust the analysis period by selecting new values from Period 1 or Period 2.
Period over period has the following properties:
-
Measures: Select the measure for which you want to see period changes.
-
Analysis period: Select the analysis period. You can adjust the analysis period by selecting new values from Period 1 or Period 2.
Period over period (detailed) has the following properties:
-
Parameters: Set the percentage limits, expected change margin, and expected change rate.
-
Favorable trend: Indicate if the favorable trend for the measure is to increase or decrease.
-
Breakdown: Select the dimension to view the detailed period changes with the measure.
-
Measures: Select the measure for which you want to see period changes.
-
Analysis period: Select the analysis period. You can adjust the analysis period by selecting new values from Period 1 or Period 2.
These analysis types have unique properties. Period changes and Period over period (detailed) have the following properties:
Insight Advisor learns your preferences for that chart if you add it to a sheet or click Learn after editing the chart. Precedents set by a user only apply to that user's instance of Insight Advisor.
Providing feedback
You can leave feedback on visualizations generated by Insight Advisor and Insight Advisor Chat. Feedback can be used by app administrators to improve the user experience, through changes to the app's business logic or to the data itself.
Click on a chart generated by Insight Advisor to provide feedback on the visualization. You can indicate a positive or negative response, and write a comment.
Dialog for providing feedback on Insight Advisor analyses

For more information, see Using feedback and usage metrics to improve app usability.
Managing general properties
In General properties, you can view and edit your hidden and learned charts and the precedents you have set for generating charts.
General properties are not available when business logic is turned on.
The following properties are available:
- Hidden recommendations contains charts you have hidden from searches. You can click
to show the chart again in searches.
- Learned recommendations contains charts you selected Learn on after editing. You can delete learned charts by clicking
.
- Your defined preferences shows all the preferences Insight Advisor has learned. You can delete preferences by clicking
.
You can clear all hidden charts, learned charts, and preferences by clicking Clear all.
Supported languages
Insight Advisor is supported in all Qlik Cloud-supported languages, but some features of Insight Advisor Search are limited to certain languages. Insight Advisor Search supports the following languages for natural language questions and insights:
| Language | Supported for natural language questions | Supported for natural language insights |
|---|---|---|
| English | Yes | Yes |
| German |
Yes |
Yes |
| Spanish |
Yes |
Yes |
| French |
Yes |
Yes |
| Italian |
Yes |
Yes |
| Dutch |
Yes |
Yes |
| Polish |
Yes |
Yes |
| Portuguese |
Yes |
Yes |
| Russian |
Yes |
No |
| Swedish |
Yes |
Yes |
Supported questions by language
The natural language questions you can ask Insight Advisor are processed as combinations of measures and dimensions. You can also apply filters, such as a time period or location.
As shown above, Insight Advisor supports natural language questions in ten languages. Certain combinations of measures, dimensions, and filters might not be supported in all of these languages.
Examples: Questions that can be asked in all supported languages
The following are examples of the kinds of questions that can be asked in all languages that Insight Advisor and Insight Advisor Chat support. Punctuation, such as question marks, is not required.
Measures only
-
Show me sales
-
Show me average cost
-
Show me sales and margin
Dimensions only
-
Show me products
-
What is sales quantity?
-
What are regions?
Measures and dimensions
-
What are sales by product group?
-
Top 5 products by cost
-
Lowest sales by product
Categorical filters
-
Show me sales by manager in USA
-
Show me sales not including Portugal
-
What are sales of produce by region?
Time filters
-
What are sales for 2022?
-
Show me sales between January 2021 and March 2022
Condition or comparator filters
-
Sales where quantity is < 10
-
Sales where costs are between 20 and 30 dollars
-
Sales where orders are less than 10 000 units
Questions without support in certain languages
The following types of questions are not supported in certain languages:
| Question variation | Example | Dutch | Polish | Russian | Swedish |
|---|---|---|---|---|---|
| Time filters | What were sales last year? | No | No | No | No |
| Time filters | Sales for 2021 over 2022 | No | No | No | No |
| Contextual questions (only in Insight Advisor Chat) |
(Initial question: What were sales in December?) How about for March? |
Yes |
Yes |
No |
Yes |
Permissions for Insight Advisor
In Qlik Cloud, your access to Insight Advisor in an app depends on:
-
Permissions assigned to you by tenant administrators. See:
-
Permissions in User Default and custom roles (capacity-based subscriptions)
-
Permissions in User Default and custom roles (user-based subscriptions)
-
Permissions in User Default and custom roles (Qlik Anonymous Access subscriptions)
-
-
For apps in shared and managed spaces, your space role in these spaces. See:
If your Qlik Cloud tenant is licensed for Qlik Answers and has turned on cross-region data processing, Insight Advisor will not be available. Use Qlik Answers with your application instead to explore your data and create sheets and visualizations.
Limitations
The following section lists limitations for Insight Advisor.
General limitations
Insight Advisor has the following general limitations:
- Insight Advisor supports master items that use dollar-sign expansions in their expressions with the following limitations:
- Expressions and captions for master items are expanded once and the results are cached. The dollar-sign expressions are not reevaluated until the expressions change or the cache expires (usually 30 days after the evaluation).
Dollar-sign expressions that are defined in a way that expands to values, such as =sum(Sales), are not supported. These expressions cannot be combined with filters in Insight Advisor. Dollar-sign expressions must expand to expressions to be used in Insight Advisor.
-
If a field name contains only numerical values, that field will be used when generating results from a natural language question instead of a superlative (such as top or bottom with the same numerical value).
For example, if you searched for top 3 service providers and one of your fields was named 3, 3 will be used in the results instead of the top 3 results for service providers.
- Time period comparisons have the following limitations:
- For searches such as year over year or month over month, the whole statement must be written out. Abbreviations such as YOY or MOM are not supported.
- Time period comparisons only support up to one measure and one dimension in the natural language question.
- English questions using the trend keyword with one measure and a time filter are not supported.
Language-related limitations
Insight Advisor Search has the following language-related limitations:
- In natural language questions, plurals of field names are only supported in English.
- Composite words containing field names are not supported for natural language questions in German, Dutch, and Swedish.
Limitations for natural language insights
The following limitations apply to natural language insights in Insight Advisor:
-
Natural language insights are not always included with supported analysis types, depending on how a natural language question is processed and the data being used.
-
Natural language insights only provide a general statement when the question includes more than two filters or more than two data value filters on a dimension. The filters used are included in the response, however.
-
Natural language insights are not available for searches with multiple dimensions or three or more measures.
Natural language insights are available for the following analysis types, depending on the combination of dimensions, measures, and fields used in the analysis:
| Analysis type | Variation | Supported for natural language insights |
|---|---|---|
| Anomaly (spike) | 1 measure, 1 time-based dimension | Yes |
| Anomaly (trend) | 1 measure, 1 time-based dimension | Yes |
| Breakdown | 2-3 dimensions, 1 measure | Yes |
| Breakdown (geospatial) | 0-1 measures, 1-2 dimensions | Yes |
| Clustering (k-means) | 1 dimension, 2 measures | Yes |
| Comparison | 1 dimension, 2 measures | Yes |
| Correlation | 0-1 dimensions, 2 measures | Yes |
| Calculated measure (KPI) | 1 measure | Yes |
| Mutual information | 2-11 fields | Yes |
| Period over period | 1 measure | Yes |
| Process control (mean) | 1 measure, 1 time-based dimension | Yes |
| Ranking | 1 dimension, 1 measure | Yes |
| Relative importance | 1 dimension, 1 measure | Yes |
| Time series decomposition | 1 measure, 1 time-based dimension | No |
| Trend over time | 1 measure, 1 time-based dimension | Yes |
| Trend with forecast | 1 measure, 1 time-based dimension | No |
