
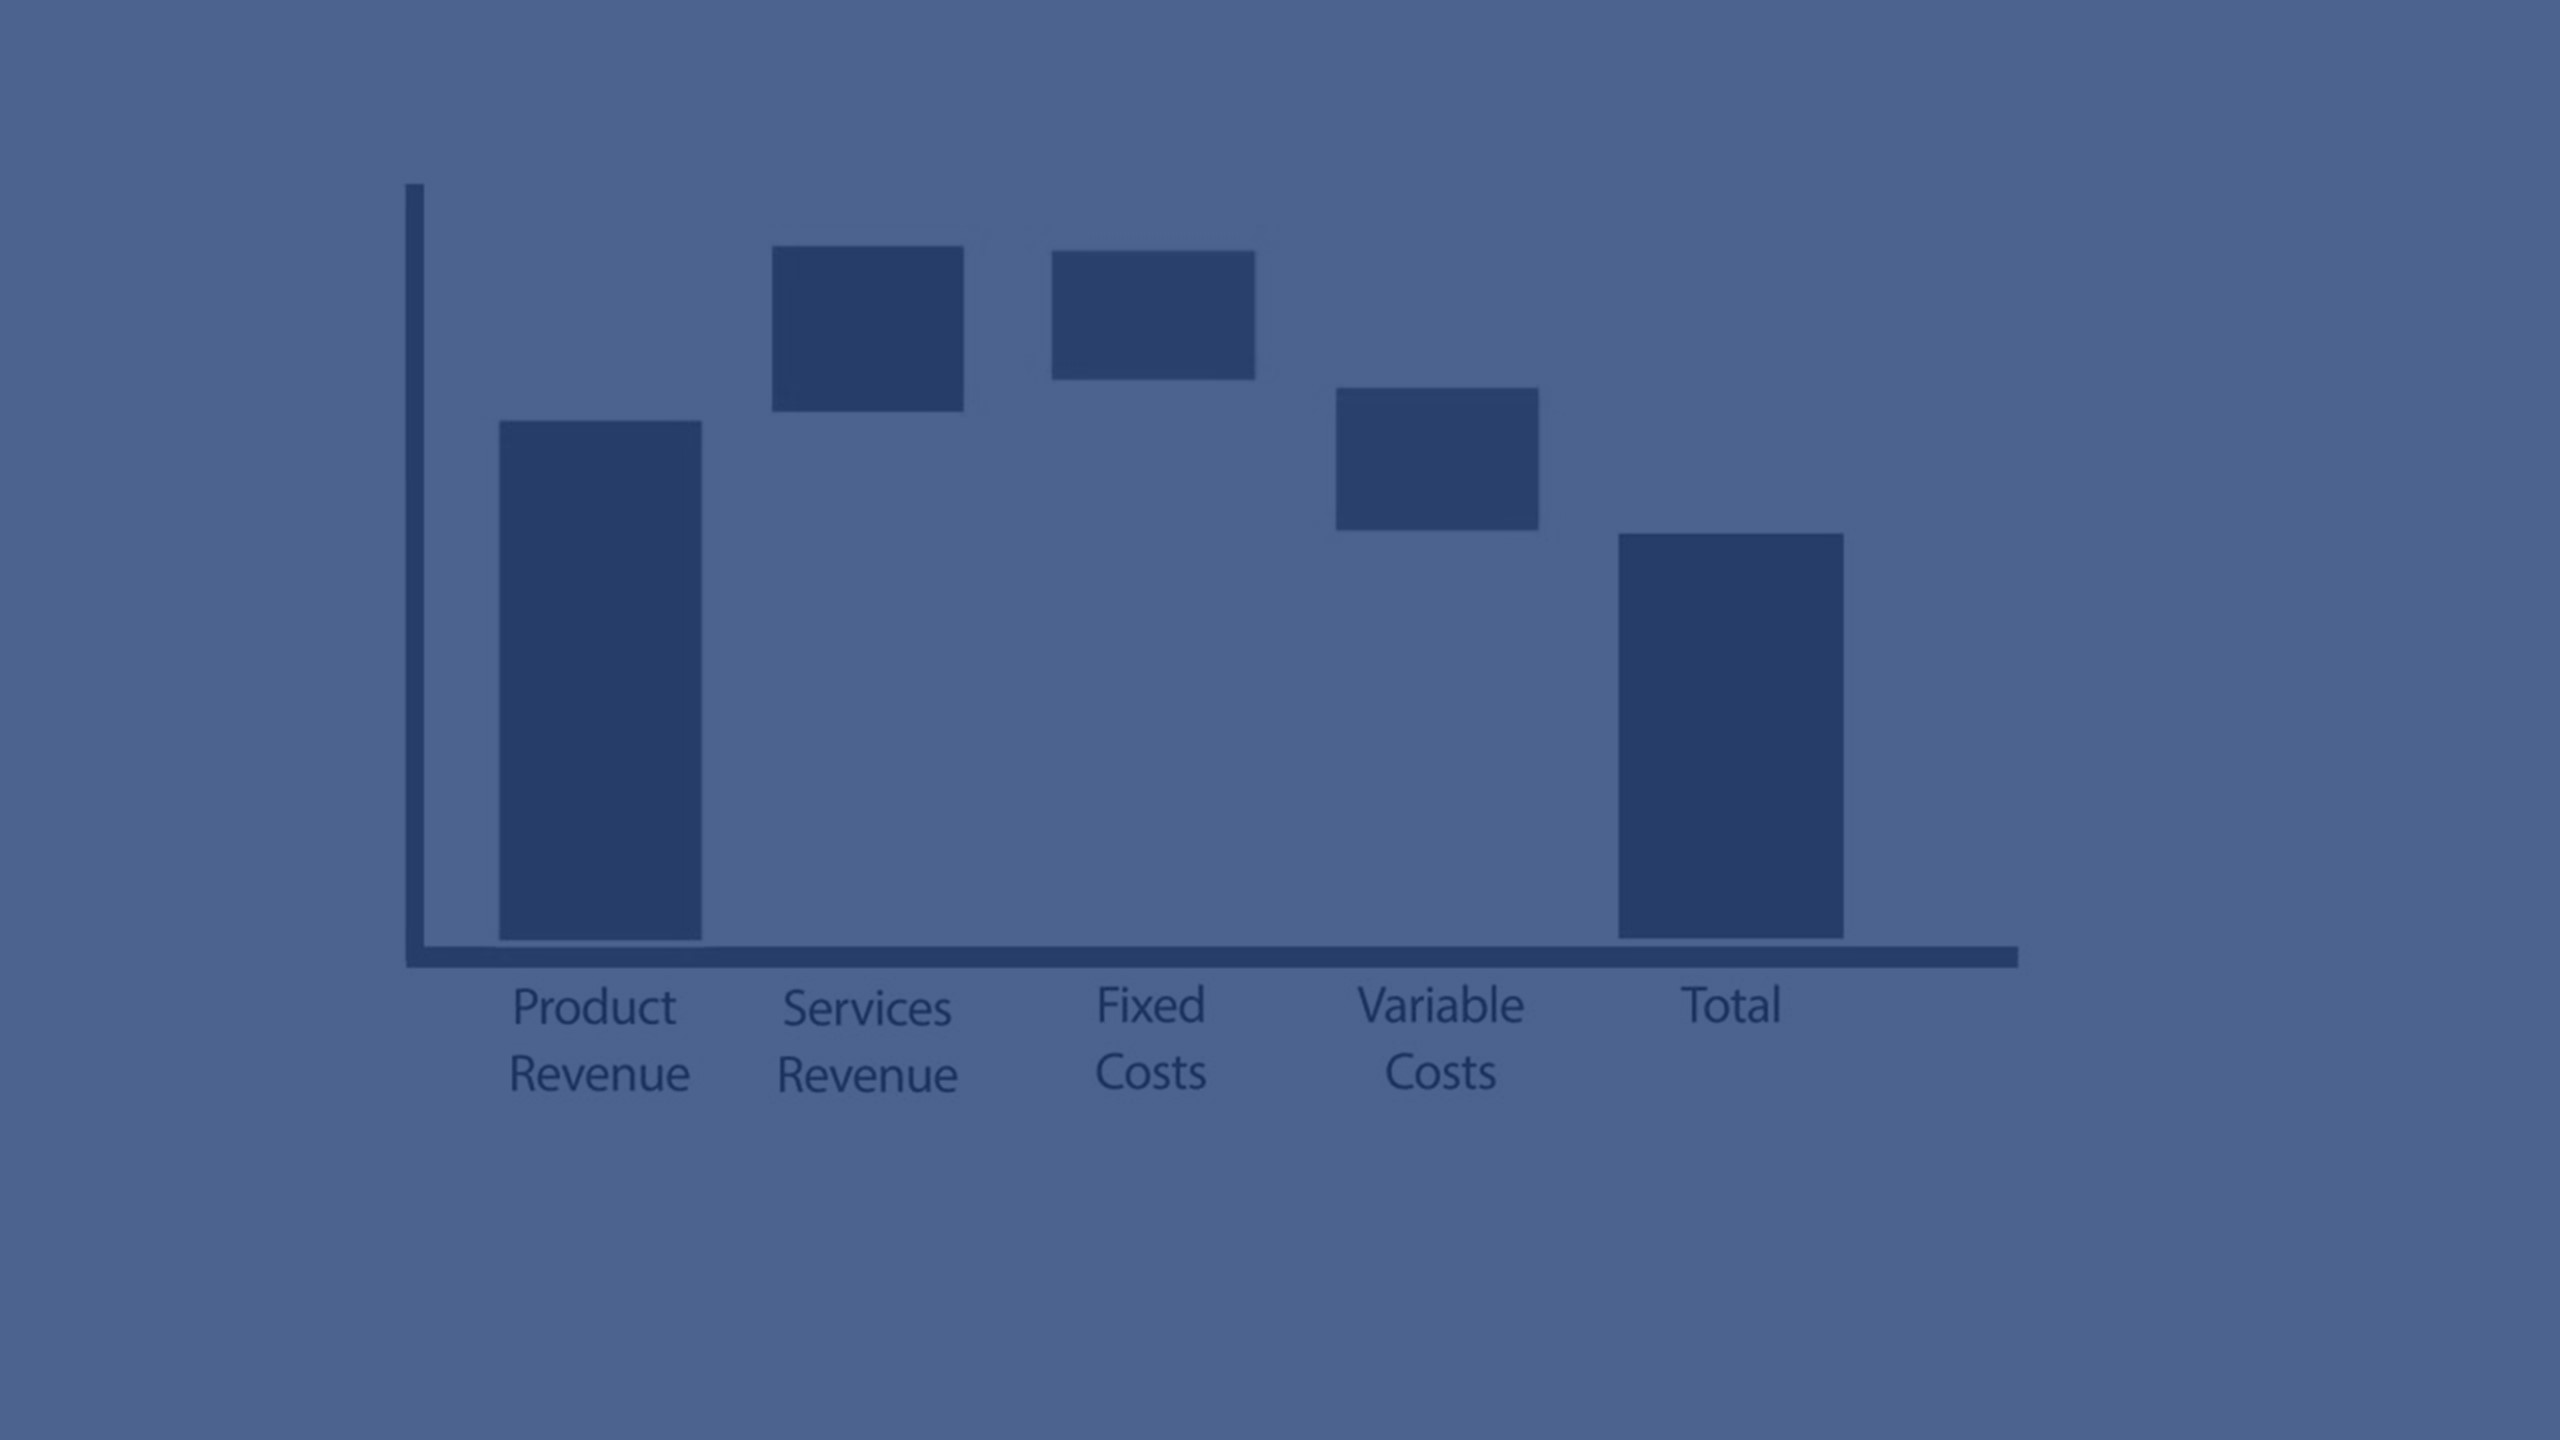
The waterfall chart is suitable for illustrating how an initial value is affected by intermediate positive and negative values. The starting and the final values are represented by whole bars, and intermediate values by floating bars. You can also show subtotals in the chart.
Waterfall chart displaying Sales, Sales cost, and Sales margin.

When to use the waterfall chart
The waterfall chart is suitable for illustrating how an initial value is affected by intermediate positive and negative values. One example of this is an income statement, when you want to show the positive and negative contributions of different accounts.
Advantages
The waterfall chart provides a quick understanding of the transition of a value.
Disadvantages
The waterfall chart is not relevant for detailed analysis of the data as you can't make selections in the chart or expand the data.