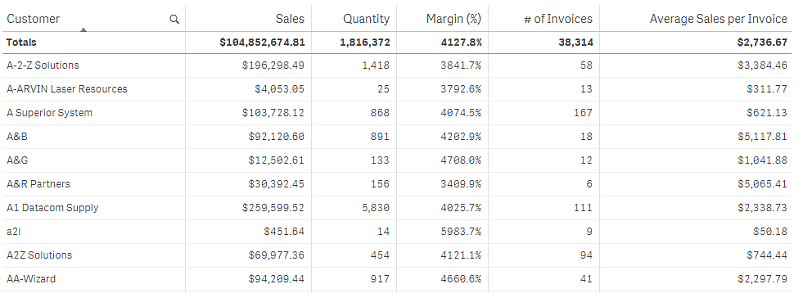
The table shows several fields simultaneously, where the content of each row is logically connected. Typically, a table consists of one dimension and several measures.
The Straight table has replaced the Table as the default table visualization. Consider upgrading existing tables to straight tables for improved functionality and performance. For information about the straight table, see Straight table.

You only make selections in the dimension columns. All dimension columns have a search icon in the header.
When to use the table chart
Use a table when you want to view detailed data and precise values rather than visualizations of values. Tables are good when you want to compare individual values. Drill-down group dimensions are very efficient in tables. Within a limited space, you can drill down to the next level of detail and analyze the updated measure values.
Advantages
You can filter and sort the table in different ways. Many values can be included in a table, and when you drill down in a table, you make good use of the limited space on a sheet. A table is excellent when you want to see exact values rather than trends or patterns.
Disadvantages
If the table contains many values, it is difficult to get an overview of how values are related. It is also hard to identify an irregularity within the table.
Display limitations
Number of rows and columns
In a table, you can have millions of rows and virtually any number of columns with dimensions and measures. But because huge tables are impractical and hard to manage, the limit for what is practical is far less than the theoretical maximum. In most cases, it is desirable to see all the columns without scrolling horizontally.
Tables with content of mixed sizes
In a table you can have both columns where the content fits on one row within the cell, and columns containing wrapped multiline text. In some cases you will see a shift in alignment and number of rows when the multiline column is scrolled in and out of view. When the view only contains content that fits on one row, the table will adjust and show all content on single line rows, which means more rows are displayed.
We recommend that you disable multiline text wrapping in these cases to avoid confusion for the user.
