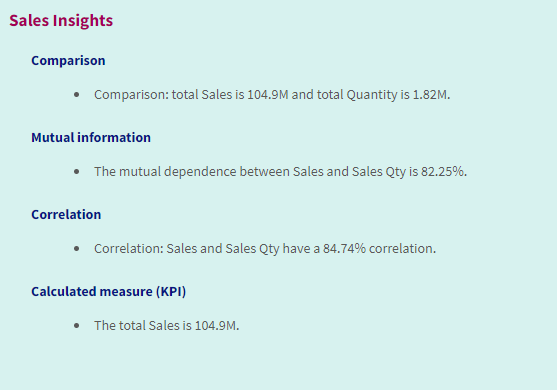
The NL insights visualization displays natural language insights and information about selected dimensions and measures.
NL insights uses Insight Advisor to generate natural language information about the dimensions and measure added to the chart. The chart updates the insights as selections are made in the app.
Native NL insights object displaying natural language insights with full verbosity

NL insights is a native chart type replacing the deprecated NL Insights control from the Dashboard bundle.
By default, NL insights generates insights for all analysis types supported for the selected fields. The classification of fields in your app logical model determines which fields are available as dimensions or measures. For more information on defining fields, see Defining fields and groups.
When to use NL insights
Use NL insights when you want to include a narrative or analytical summary of your data. For example, on a sheet focused on sales, you might want narratives summarizing key ranking, correlation, and comparison analyses for sales to complement your other visualizations.
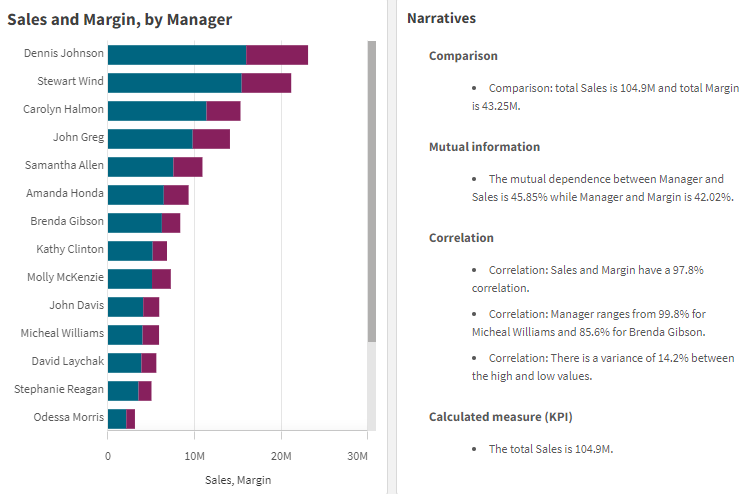
It is also helpful to pair NL insights with another chart containing the same dimensions and measures. This provides additional context and information for the chart. To do this, configure the NL insights object to use an input chart that has already been created on the current sheet. The dimensions and measures from that input chart are used to generate the natural language insights, and the NL insights will update based on changes you make in the input chart.
NL insights with natural language insights generated directly from input bar chart

Migrating from the Dashboard bundle to native object
NL Insights extension objects from the Dashboard bundle must be migrated to native charts if they appear on a public (base) sheet or published (community) sheet. To do this, follow the applicable steps to make the sheet private, then publish and/or make it public again.
Personal and shared spaces
Do the following:
-
Open the app overview, or open
Sheets from sheet view.
-
Right-click the public sheet and select Make private.
-
Open the private sheet and ensure the chart has been migrated.
-
Under your private sheets, right-click the sheet and select Make public.
Managed spaces
Public sheets
Do the following:
-
Open the app overview, or open
Sheets from sheet view.
-
Right-click the public sheet and select Duplicate.
-
Open the duplicated private sheet and ensure the chart has been migrated.
-
Right-click the sheet and select Publish.
This publishes the sheet to the Community, under My sheets.
If you instead need the sheet to be re-added as a public sheet, you will need to open the source app in the personal or shared space, then make the sheet private and then public again. Finally, re-publish the app to the managed space.
Published sheets
Do the following:
-
Open the app overview, or open
Sheets from sheet view.
-
Right-click the published sheet and select Unpublish.
-
Open the private sheet and ensure the chart has been migrated.
-
Right-click the sheet and select Publish.
Creating NL insights
You need at least one dimension or one measure to create the chart. Combine dimensions and measures as needed. If you use an existing chart to generate the content of your NL insights, the dimensions and measures from that input chart are used and will be dynamically updated if you change the input chart.
Do the following:
-
In the assets panel, open Charts.
-
Under Dashboard objects, drag an empty NL insights chart to the sheet.
-
Click Add chart to use natural language insights from an existing chart in the NL insights visualization. Choose from any of the supported charts in the current sheet.
Alternatively, click Add dimension or Add measure to add natural language insights from a dimension or measure into the chart.
-
In the properties panel, add or remove dimensions and measures from the chart.
Information noteYou cannot add or remove dimensions and measures if you have chosen to use insights from an existing chart.
When you have created the NL insights visualization, you might want to adjust its appearance and other settings in the properties panel. For information about how to style the visualization, see Styling NL insights.
Styling NL insights
You have a number of styling options available under Appearance in the properties panel.
Click Styling under Appearance > Presentation to further customize the styling of the chart. The styling panel contains various sections under the General and Chart tabs.
You can reset your styles by clicking next to each section. Clicking
Reset all resets styles for all available tabs in the styling panel.
For general information about styling an individual visualization, see Applying custom styling to a visualization.
Customizing the text
You can set the text for the title, subtitle, and footnote under Appearance > General. To hide these elements, turn off Show titles.
The visibility of the different labels on the chart depends on chart-specific settings and label display options. These can be configured in the properties panel.
You can style the text that appears in the chart.
Do the following:
-
In the properties panel, expand the Appearance section.
-
Under Appearance > Presentation, click
Styling.
-
On the General tab, set the font, emphasis style, font size, and color for the following text elements:
-
Title
-
Subtitle
-
Footnote
-
-
On the Chart tab, style the following text elements:
- Analysis type: Set the font, font size, and color of the headers displaying the analysis types of the insights.
- Style: Set the font, font size, and color of the narrative insights.
- Structure: Set how the narrative insights in the chart should be presented. Choose bullet points or sentences.
Customizing the background
You can customize the background of the chart. The background can be set by color and image.
Do the following:
-
In the properties panel, expand the Appearance section.
-
Under Appearance > Presentation, click
Styling.
-
On the General tab of the styling panel, you can select a background color (single color or expression). You can also set the background to an image from your media library or from a URL.
Information noteTo add a background image from a URL, the origin must be added to the allowlist in your tenant's Content Security Policy. Add the origin with the img-src directive. This is done in the Administration activity center by an administrator.
For more information, see Creating a CSP entry.
When using a background color, use the slider to adjust the opacity of the background.
When using a background image, you can adjust image sizing and position.
Customizing the border and shadow
You can customize the border and shadow of the chart.
Do the following:
-
In the properties panel, expand the Appearance section.
-
Under Appearance > Presentation, click
Styling.
-
On the General tab of the styling panel, under Border, adjust the Outline size to increase or decrease the border lines around the chart.
-
Select a color for the border.
-
Adjust the Corner radius to control the roundness of the border.
-
Under Shadow in the General tab, select a shadow size and color. Select None to remove the shadow.
Adjusting the verbosity
You can control the verbosity of the generated insights. Verbosity can be full or brief. Full verbosity groups natural language insights by analysis type. Brief verbosity displays all natural language insights as a list.
Verbosity can be configured under Appearance > Presentation in the properties panel.
Removing analysis types
You can remove unwanted analysis types from NL Insights under Appearance > Presentation in the properties panel.
Changing the language of the natural language insights
You can change the language of the generated natural language insights under Appearance > Presentation in the properties panel in advanced edit mode.
Considerations
The analysis types and number of narrative insights generated in the NL insights chart depend on the volume and variety of data that belongs to the fields selected. A limited number of analysis types and insights might be displayed in the following scenarios:
-
The selected items use the same underlying field with aggregations or selections.
-
The selected items include only measures and no dimensions.
-
The selected items are mostly unrelated.
Limitations
The NL insights object has the following the limitations:
-
You cannot use the following chart types for direct input into the NL insights chart:
-
Animator
-
Button
-
Container
-
Date picker
-
Filter pane
-
Text & image
-
Video player
-
-
The NL insights chart does not provide natural language insights for the following analysis types (even if it uses an input chart generated from these analysis types):
-
Anomaly (spike)
-
Anomaly (trend)
-
Clustering (k-means)
-
Overview
-
Period changes
-
Process control (rolling mean)
-
Year to date
-
-
Expressions with modifiers, either applied directly to the chart or via an input chart, might not provide correct values in natural language insights.
-
The number format accompanying an expression is only applied to narrative statements generated using that expression. Additional narratives that are generated might not adhere to the expression's number format.
-
When using an existing chart as the input for an NL insights object, certain actions taken on the input chart will not result in the natural language insights being updated automatically. Specifically, switching to alternative measures or dimensions, or customizations made through chart exploration in analysis mode, do not update natural language insights unless those changes are applied and made available for all users.
-
Changing the number format of a measure might not always result in this formatting being changed in all available insights.
-
The NL insights chart is not available for consumption by anonymous (non-authenticated) users through the sharing of an app with a Qlik Anonymous Access subscription. This means that the chart cannot be embedded into external content for anonymous consumption. In apps that are shared anonymously via a public link, the chart does not appear.
