
Line
Add lines to your sheets with the Line control.
With Line controls, you can add vertical and horizontal lines to your sheets. They can be dotted or solid.
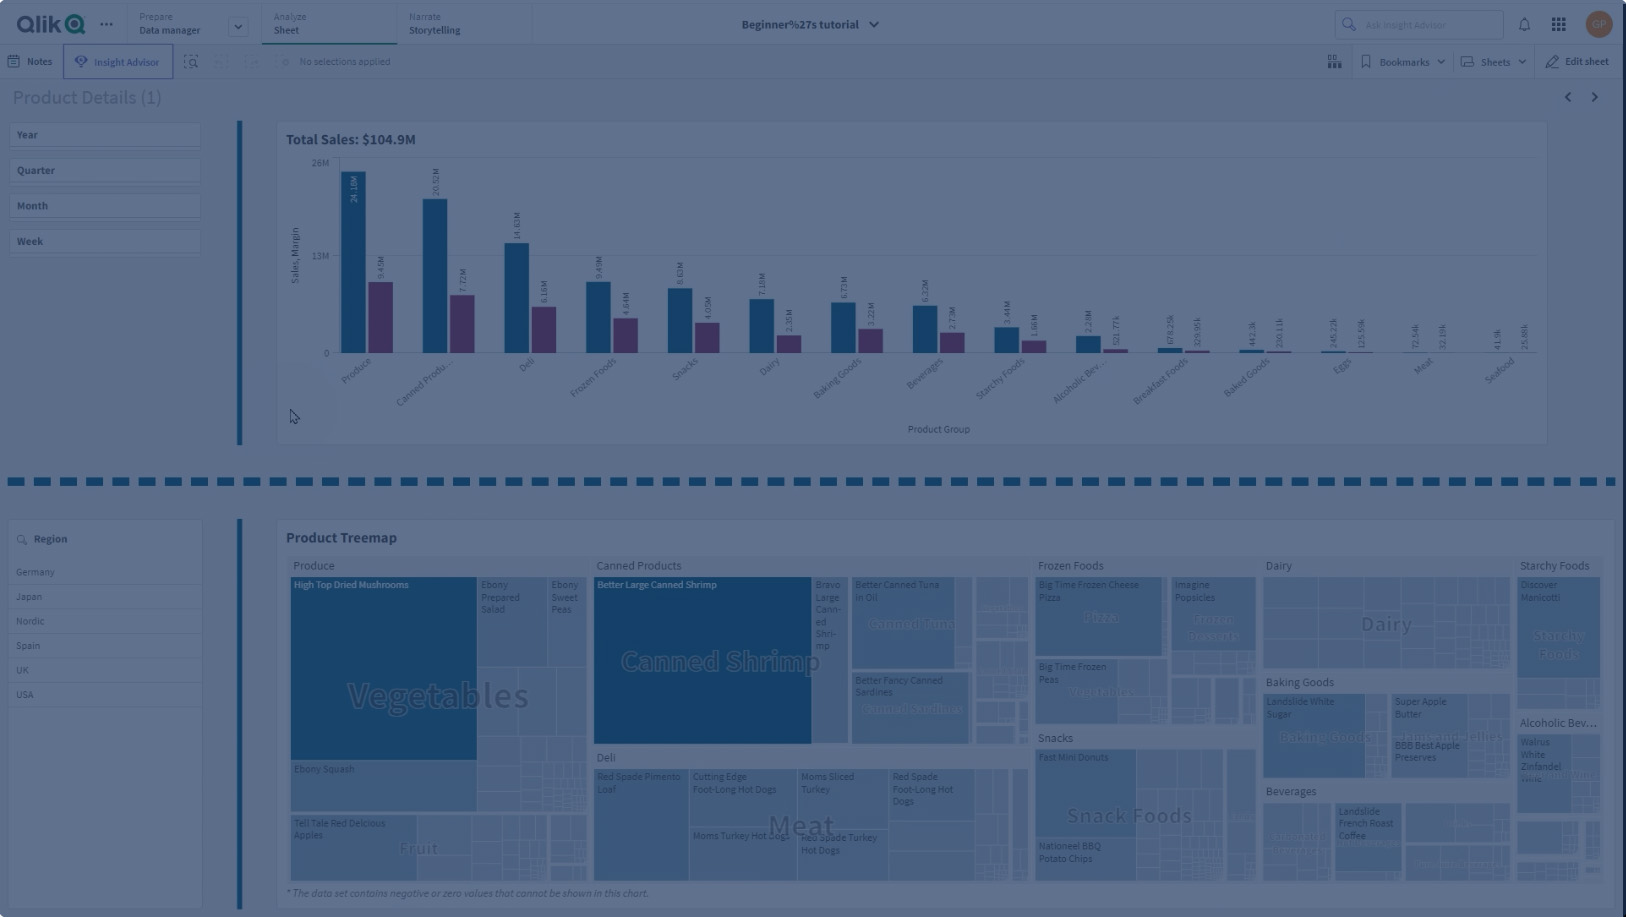
Line in a sheet dividing visualizations

When to use the Line control
The Line control is useful for helping to group or divide sheet objects, as well as decorating sheets to help improve visual appeal.
Creating lines
Do the following:
- In the assets panel, open Charts.
- Under Dashboard objects, drag Line to the sheet.
- Adjust the Line on the grid.
- In the properties panel, in Presentation under Orientation, select Vertical or Horizontal.
-
Under Alignment, select:
-
Leading: Line is placed to the left (vertical orientation) or top (horizontal orientation) of Line on the grid.
-
Center: Line is placed in the center of Line on the grid.
-
Trailing: Line is placed to the right or bottom of Line on the grid.
-
- Under Stroke, set the following line styling options.
- Color: Select the color of the line.
- Width: Set the width of the line.
- Dash: Set whether the line is solid or dashed. If the line is dashed, the following options are available:
- Dash length: Set the length of dashes in the line.
- Dash spacing: Set the gap between dashes in the line.
- Optionally, to add a title, subtitle, or footnote, under General, select Show titles.
Styling Line controls
You have a number of styling options available under Appearance in the properties panel.
Click ![]() Styling under Appearance > Presentation to further customize the styling of the chart. The styling panel contains various sections under the General tab. You can reset your styles by clicking
Styling under Appearance > Presentation to further customize the styling of the chart. The styling panel contains various sections under the General tab. You can reset your styles by clicking ![]() next to each section.
next to each section.
Customizing the text
You can set the text for the title, subtitle, and footnote under Appearance > General. To hide these elements, turn off Show titles.
The visibility of the different labels on the chart depends on chart-specific settings and label display options. These can be configured in the properties panel.
You can style the text that appears in the chart.
Do the following:
-
In the properties panel, expand the Appearance section.
-
Under Appearance > Presentation, click
 Styling.
 -
On the General tab, set the font, emphasis style, font size, and color for the following text elements:
-
Title
-
Subtitle
-
Footnote
-
Customizing the background
You can customize the background of the chart. The background can be set by color and image.
Do the following:
-
In the properties panel, expand the Appearance section.
-
Under Appearance > Presentation, click
Styling. -
On the General tab of the styling panel, you can select a background color (single color or expression). You can also set the background to an image from your media library or from a URL.
Information noteTo add a background image from a URL, the origin must be added to the allowlist in your tenant's Content Security Policy. Add the origin with the img-src directive. This is done in the Administration activity center by an administrator.
For more information, see Creating a CSP entry.
When using a background color, use the slider to adjust the opacity of the background.
When using a background image, you can adjust image sizing and position.
Customizing the border and shadow
You can customize the border and shadow of the chart.
Do the following:
-
In the properties panel, expand the Appearance section.
-
Under Appearance > Presentation, click
Styling. -
On the General tab of the styling panel, under Border, adjust the Outline size to increase or decrease the border lines around the chart.
-
Select a color for the border.
-
Adjust the Corner radius to control the roundness of the border.
-
Under Shadow in the General tab, select a shadow size and color. Select None to remove the shadow.
Limitations
Line has the following limitations:
-
You cannot connect the lines in separate Line controls together. If you want to have intersecting lines in your sheet, consider using a background image with the lines on the sheet instead.