
Time series forecasting with the line chart
Business users and analysts often monitor their measures as a trend over time and with time series forecasting they can estimate how the historical sequence of observations will continue into the future. The ability to predict how trend lines are likely to evolve can inform strategy and decision-making. In Qlik Cloud, a time series forecasting option produces visualizations that extend trend lines with predicted values generated and presented on the line chart. Depending on the method employed, a shaded area representing the confidence interval, displays possible values with a configurable level of confidence. Time series forecasts are produced using trusted, predictive functions; SSA (singular spectrum analysis) algorithm provides a confidence interval and the OLS (ordinary least squares) method provides a simple linear regression line.
Time series forecast chart built with OLS method

Time series forecast chart built with SSA method

Time series forecast differentiates predicted values clearly from historical values. The visualization displays the forecast incrementally as configured by Forecast steps and Step size multiplier selections in dimension properties. When the SSA method is selected in the measure, a shaded region representing the prediction confidence interval displays. This interval is configured through measure properties: Show confidence and Confidence level. The shaded region shows the interval of plausible values (ex., 95%) meaning that future values are expected to lie within the shaded area with a probability of 95%.
Requirements and properties behavior
A Forecast toggle appears in the advanced options measure properties when the following requirements are met:
- A numerical or time dimension
- One measure and one dimension
- The dimension axis must be continuous.
It is important to note that the Forecast toggle setting appears in measure properties only when the measure is a numerical or time dimension and the dimension axis is continuous. When it is toggled on, forecast time series properties display in both dimension and measure panels. Dimension properties address horizon distance and increment settings. Measure properties set method, line and shadow styling, the confidence setting and level.
OLS and SSA methods
OLS (Ordinary Least Square) is a simple regression model method that calculates a trend line by minimizing the sum of the squares of the differences between the observed dependent variable and the predicted dependent variable. This time series forecast option is good for when the user wants to see the linear trend of their data; it does not control for noise or outliers, it simply uses all data to generate a linear regression line.
Relative to OLS, SSA (Singular Spectrum Analysis) is a sophisticated algorithm capable of identifying noise and seasonality as well as trend. SSA requires data to be sufficiently regularly sampled, if it exceeds a certain limit, an error is returned indicating that the data is too irregular. SSA is the best option to forecast trends with cyclical or oscillatory behavior.
In a case where the SSA method is employed to produce a forecast, this algorithm estimates the middle of the range of possible values the dependent measure takes. The line is augmented by a prediction interval providing a range of values that it could take. Instead of displaying many possible values, the prediction interval is shown as shaded area.
Time series forecast limitations
Time series forecasting has the following limitations:
- Forecast is not enabled for drilldown dimensions.
- Forecast is not enabled for charts with more than one dimension. In the case of one dimension and multiple measures, only one measure can have forecast enabled.
- Forecast only works when default sorting is in place. For more information see Change the sorting of a visualization.
- Minimum datapoints: OLS requires at least 2 datapoints. SSA requires at least 6 datapoints.
-
Maximum datapoints: It is not recommended to use algorithms on datasets with more than 5000 datapoints. Users will begin to encounter performance issues when running time series forecast for datasets with over 5000 datapoints. Users and application designers should use the calculation condition as required so that when the dataset is reduced through selections, the chart will display. The selections should be continuous; see the following point regarding irregular time sampling.
-
Forecast will work with irregular time sampling under certain circumstances: OLS will always work as it is not limited to time series forecast or regular data. SSA requires data sampling to be sufficiently regular and if it exceeds an imposed limit, an error is returned indicating that the data was too irregular.
-
Forecast will not work in the Qlik Analytics mobile app in offline mode.
-
If an application with forecast is exported from Qlik Cloud and imported into QSEoW, the forecast chart will not display. Forecast is not supported in QSEoW.
-
When you download a line chart as a Microsoft Excel file, forecasted values are not included in the file.
-
When you right-click a line chart and select View data, forecasted values are not shown.
-
Time series forecasting is not available if any of the dimensions or measures in the line chart use a show condition.
Example
This example demonstrates creation of a line chart with time series forecast enabled. The example takes a dataset with two fields: Date for the continuous dimension and Tot-KWh, daily electricity usage (Kilowatt hours) for the measure. Forecast is enabled to visualize where the energy consumption rates are likely to fall within a configurable confidence interval.
Load script
Load the following data as an inline load in the data load editor:
MyTable:
Load * Inline [
Date,Tot-KWh
2021-10-27,269
2021-10-28,380
2021-10-29,410
2021-10-30,380
2021-10-31,344
2021-11-01,275
2021-11-02,299
2021-11-03,545
2021-11-04,326
2021-11-05,405
2021-11-06,333
2021-11-07,395
2021-11-08,416
2021-11-09,697
2021-11-10,500
2021-11-11,600
2021-11-12,560
2021-11-13,494
2021-11-14,362
2021-11-15,470
2021-11-16,366
2021-11-17,548
];
For more information about using inline loads, see Using inline loads to load data.
Creating a line chart with time series forecasting
Do the following:
- From the assets panel, drag an empty line chart to a new sheet.
- Select Click to add title and name the chart Daily electricity consumption in KW hours.
- Select Add dimension and add the field Date.
- Select Add measure and add the measure Avg([Tot-KWh]).
- In the Appearance section of the properties panel, expand Presentation properties, and select None for Scrollbar.
- Open the measure properties and select the following properties:
- Use the selector to turn Forecast: On.
- Change the Color to #006580.
- Move the slider to change Line thickness to 2.
- Select Line type: Dashed.
- Keep the default value for Line curve: Linear.
- Keep the default value for Show confidence: On.
- Change the Confidence level value from the default value of .95 to .85.
Measure properties for forecast

- Open the dimension properties and select the following properties:
- Keep the default value for Forecast steps: 3.
- Keep the default value for Step size multiplier: 1.
- Keep the time and number unit dropdown selection: Days.
Dimension properties for forecast

- Expand dimension properties:
- Keep the value for Forecast steps: 3.
- Keep the default value for Step size multiplier: 1.
- Change the time and number unit dropdown selection: Weeks.
- In the Presentation section, select Show data points.
- Expand dimension properties:
- Change the value for Forecast steps: 21.
- Keep the default value for Step size multiplier: 1.
- Change the time and number unit dropdown selection: Days.
- In the Presentation section, select Show data points.
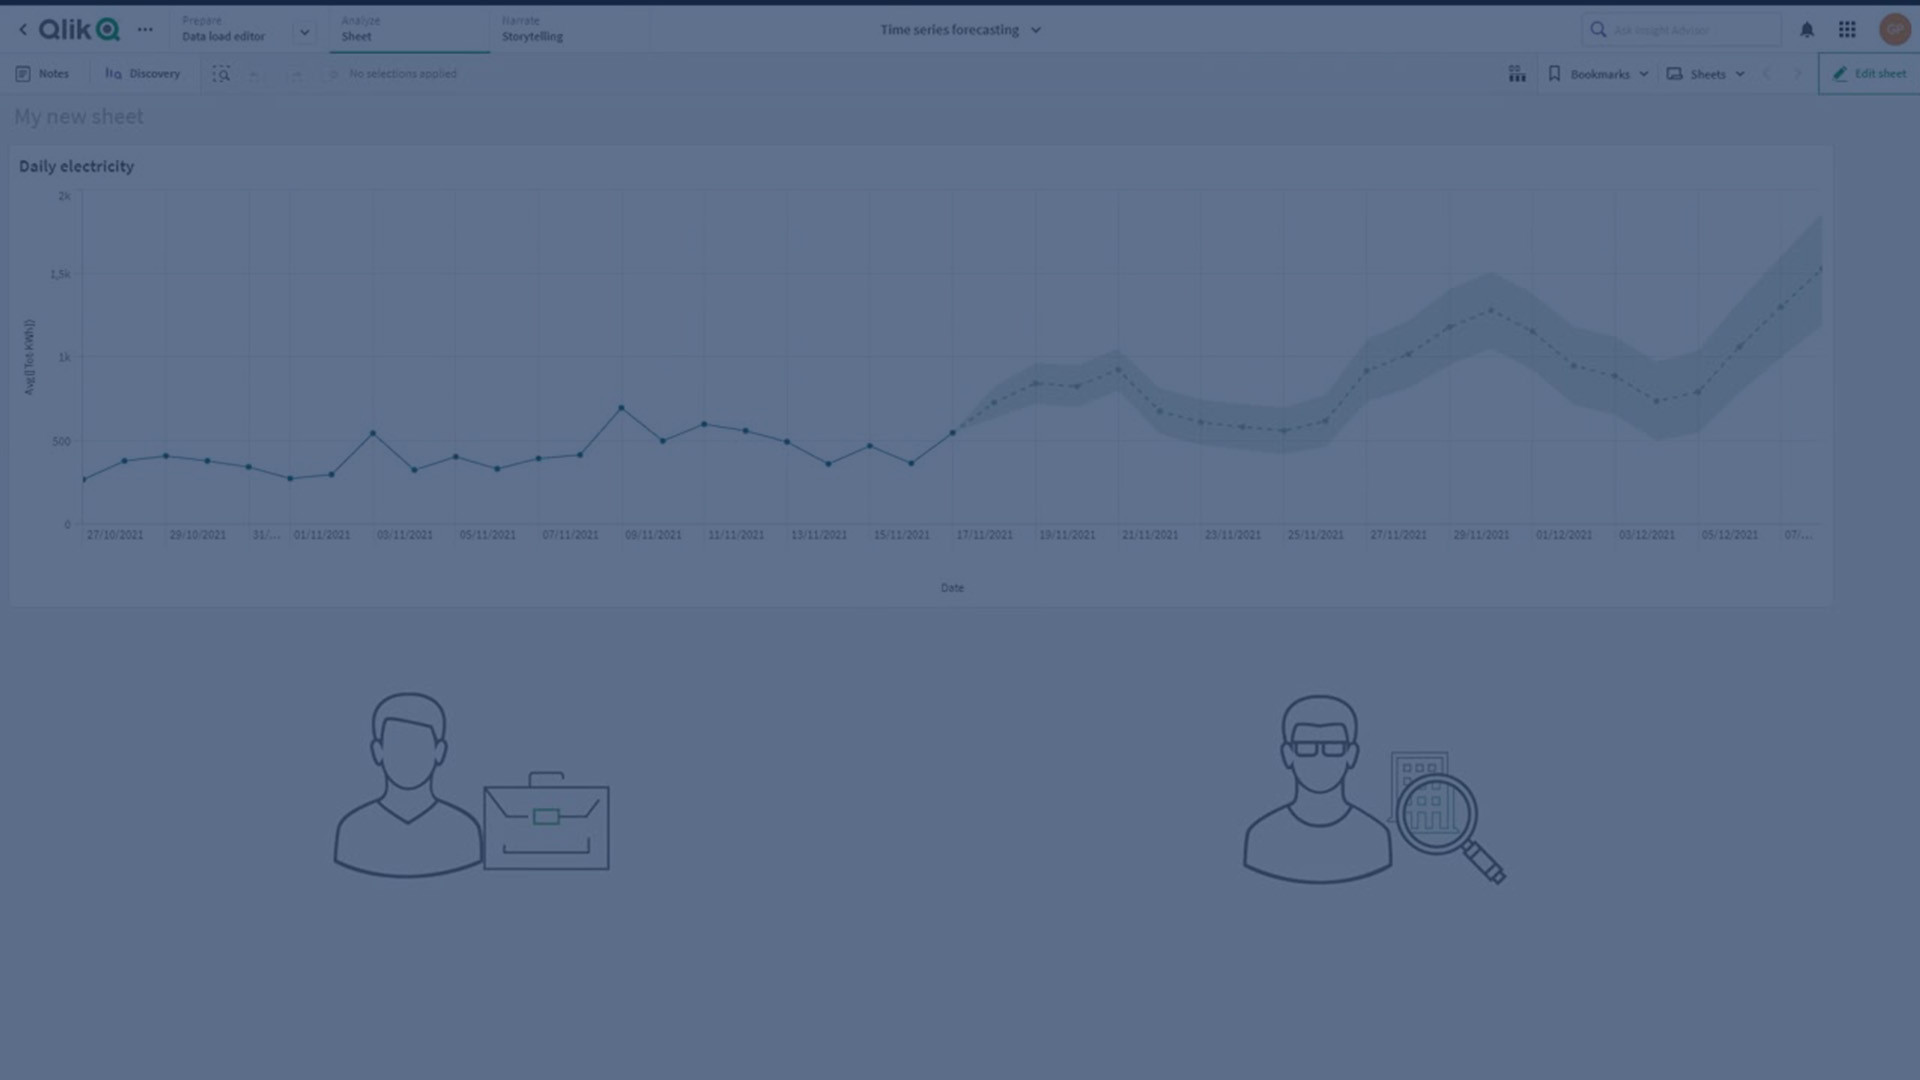
Line chart with forecast showing days interval

Forecasting with weeks interval over 3 weeks

This demonstration highlights how forecasts can render very differently based on granularity of time units (days versus weeks) over the same time interval.
Forecasting with days interval over 3 weeks

Time series forecasting with Qlik Predict
With Qlik Predict, you can train machine learning models to predict future metrics based on time series data. Predictions are time-specific and can be incorporated into the line chart and other visualizations in your analytics application. Models allow multiple features and individualized predictions for different groups categorizing the data for your target metric. This allows you to explore and predict patterns for multivariate scenarios—those involving the interaction of more than one variable over time.
To create time series forecasts in Qlik Predict, create a time series experiment, and then deploy a model to create predictions on new data.
For more information, see: