
Create a custom tooltip to add extra information to a visualization. You can include measures a master visualization chart or an image. Tooltips display when you hover over a visualization.
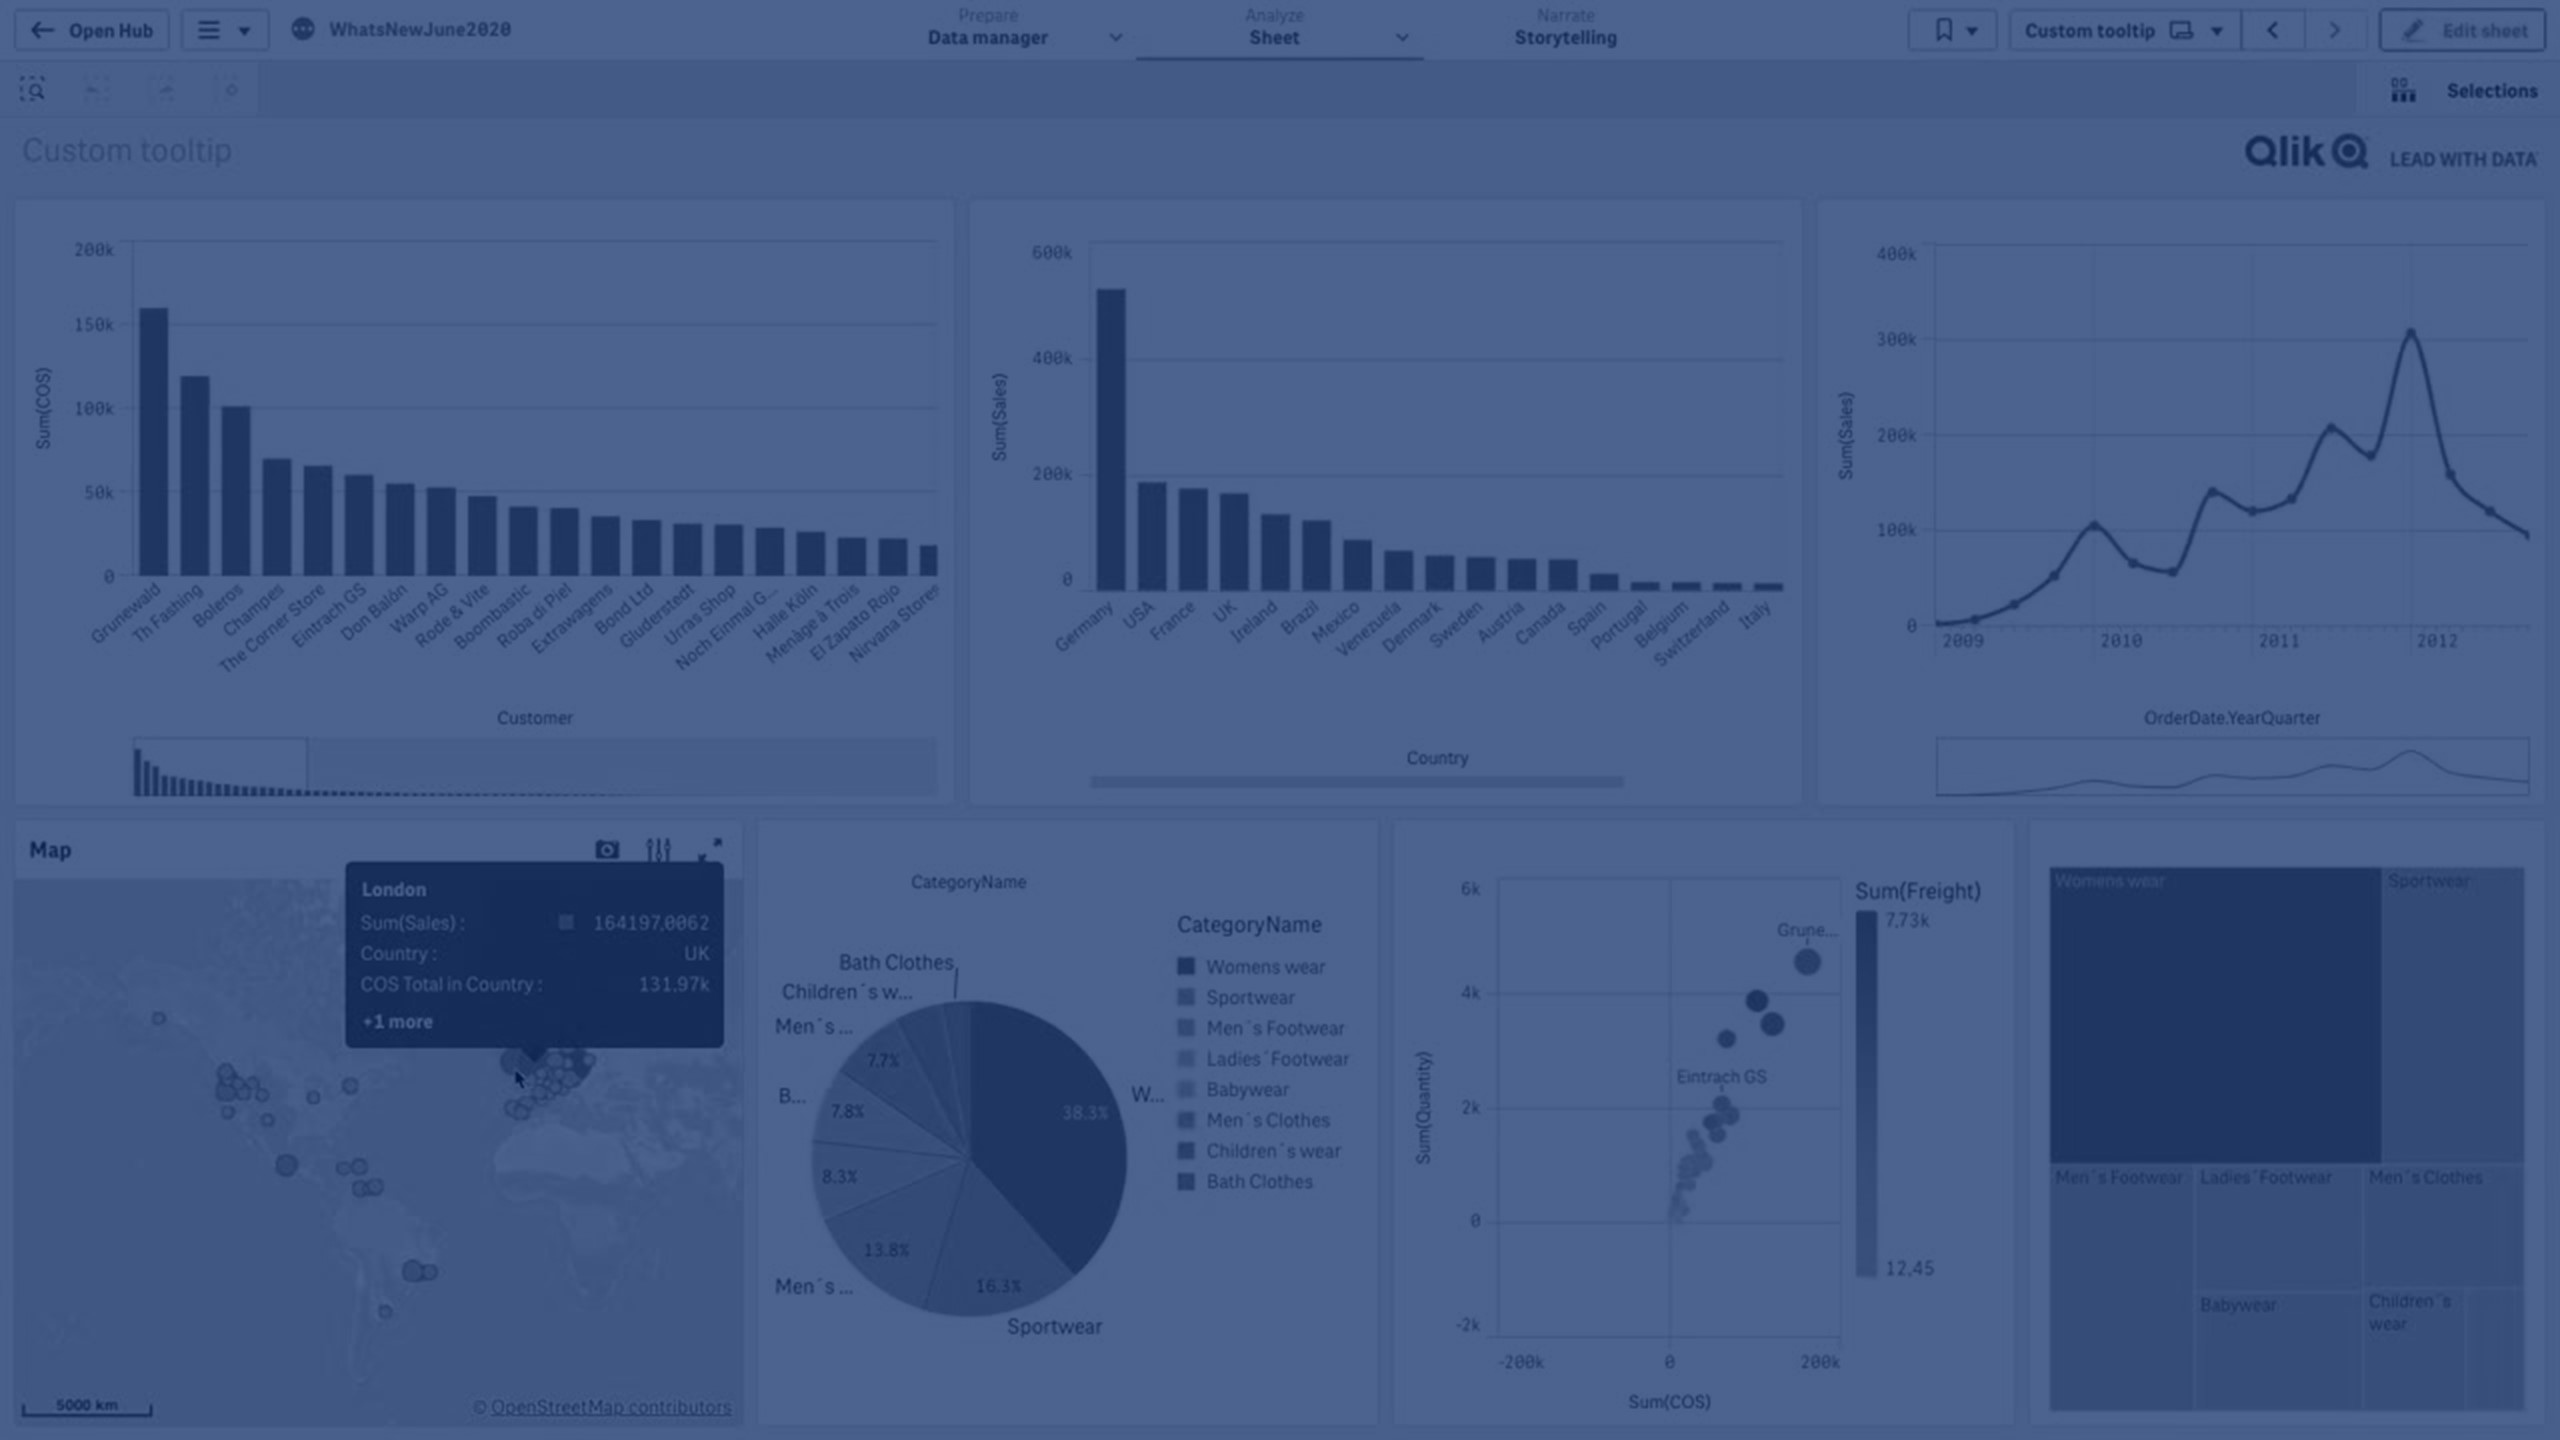
Custom tooltip over a pie chart slice

Custom tooltips are available with the following visualization types:
- Bar chart
- Bullet chart
- Combo chart
- KPI
- Line chart
- Map
- Pie chart
- Scatter plot
- Treemap
Creating a custom tooltip
Tooltips can contain measures, a chart, or an image. Add a measure from a field or using an expression. Select a chart from the master visualizations available in the application. Choose an image from the media library or by URL. You can also hide the basic rows that appear in a tooltip by default.
Do the following:
-
In sheet view, click
 Edit sheet in the toolbar.
 -
Select the chart to edit.
- In the properties panel, click Appearance, and then click Tooltip.
-
Set the toggle to Custom.
-
Optionally, enter a Title and Description for the tooltip.
Click
 to use the expression editor if you need to add more than 512 characters.
 - If you want to add a measure, under Measures, click Add measure. Select a measure from a field using From a field, or use an expression. The existing expression displays by default, or you can create a custom expression. Click to open the expression editor. You can change the label of the tooltip using Label as well as its formatting using Number formatting.
- If you want to add a chart, under Chart, click Add chart.
- From the Master items list, select the master visualization to add to the tooltip.
- Under Chart size, select the size of the chart container in the tooltip.
- Small. Sets the width and height of the container to 140 pixels.
- Medium. Sets the width and height of the container to 200 pixels.
- Large. Sets the width and height of the container to 340 pixels.
Tip noteAfter you add the chart, you can edit it by clicking Edit master item. See Editing a master visualization. - If you want to add an image, under Images, Click Add an image.
- Under Type, select whether to add the image from your Media library or from a URL.
- Media library: Select the image from the media library.
- URL: Enter a URL. Your Qlik Sense administrator must allowlist external URLs in the Content Security Policy.
- Under Size, select the size of the image container in the tooltip.
- Small. Sets the width and height of the container to 50 pixels.
- Medium. Sets the width and height of the container to 200 pixels.
- Large. Sets the width and height of the container to 340 pixels.
- Original. Qlik Sense fits the image into the container. If the image is larger than 340 pixels, it is scaled down.
Limitations
Custom tooltips have the following general limitations:
-
Custom tooltips are disabled for a bar or line chart if any of the dimensions in the chart are using a show condition.
Limitations of charts in custom tooltips
Charts have the following limitations with custom tooltips:
- Charts will not appear in custom tooltips when selecting visualizations on touch devices.
- Treemap chart must have only one dimension to use the chart in a custom tooltip.
- Chart in tooltip is not supported in Storytelling.
- Using container and trellis container charts inside a custom tooltip is not supported.
- Charts within custom tooltips will not be included in the tooltip when you are monitoring a visualization.