
Build and explore data analytics applications with Qlik Cloud.
Application overview
When you open an application from your activity center, you arrive at the application overview.
See all the content that the application contains, such as sheets, stories, and bookmarks and navigate between the different views.
For more information, see:

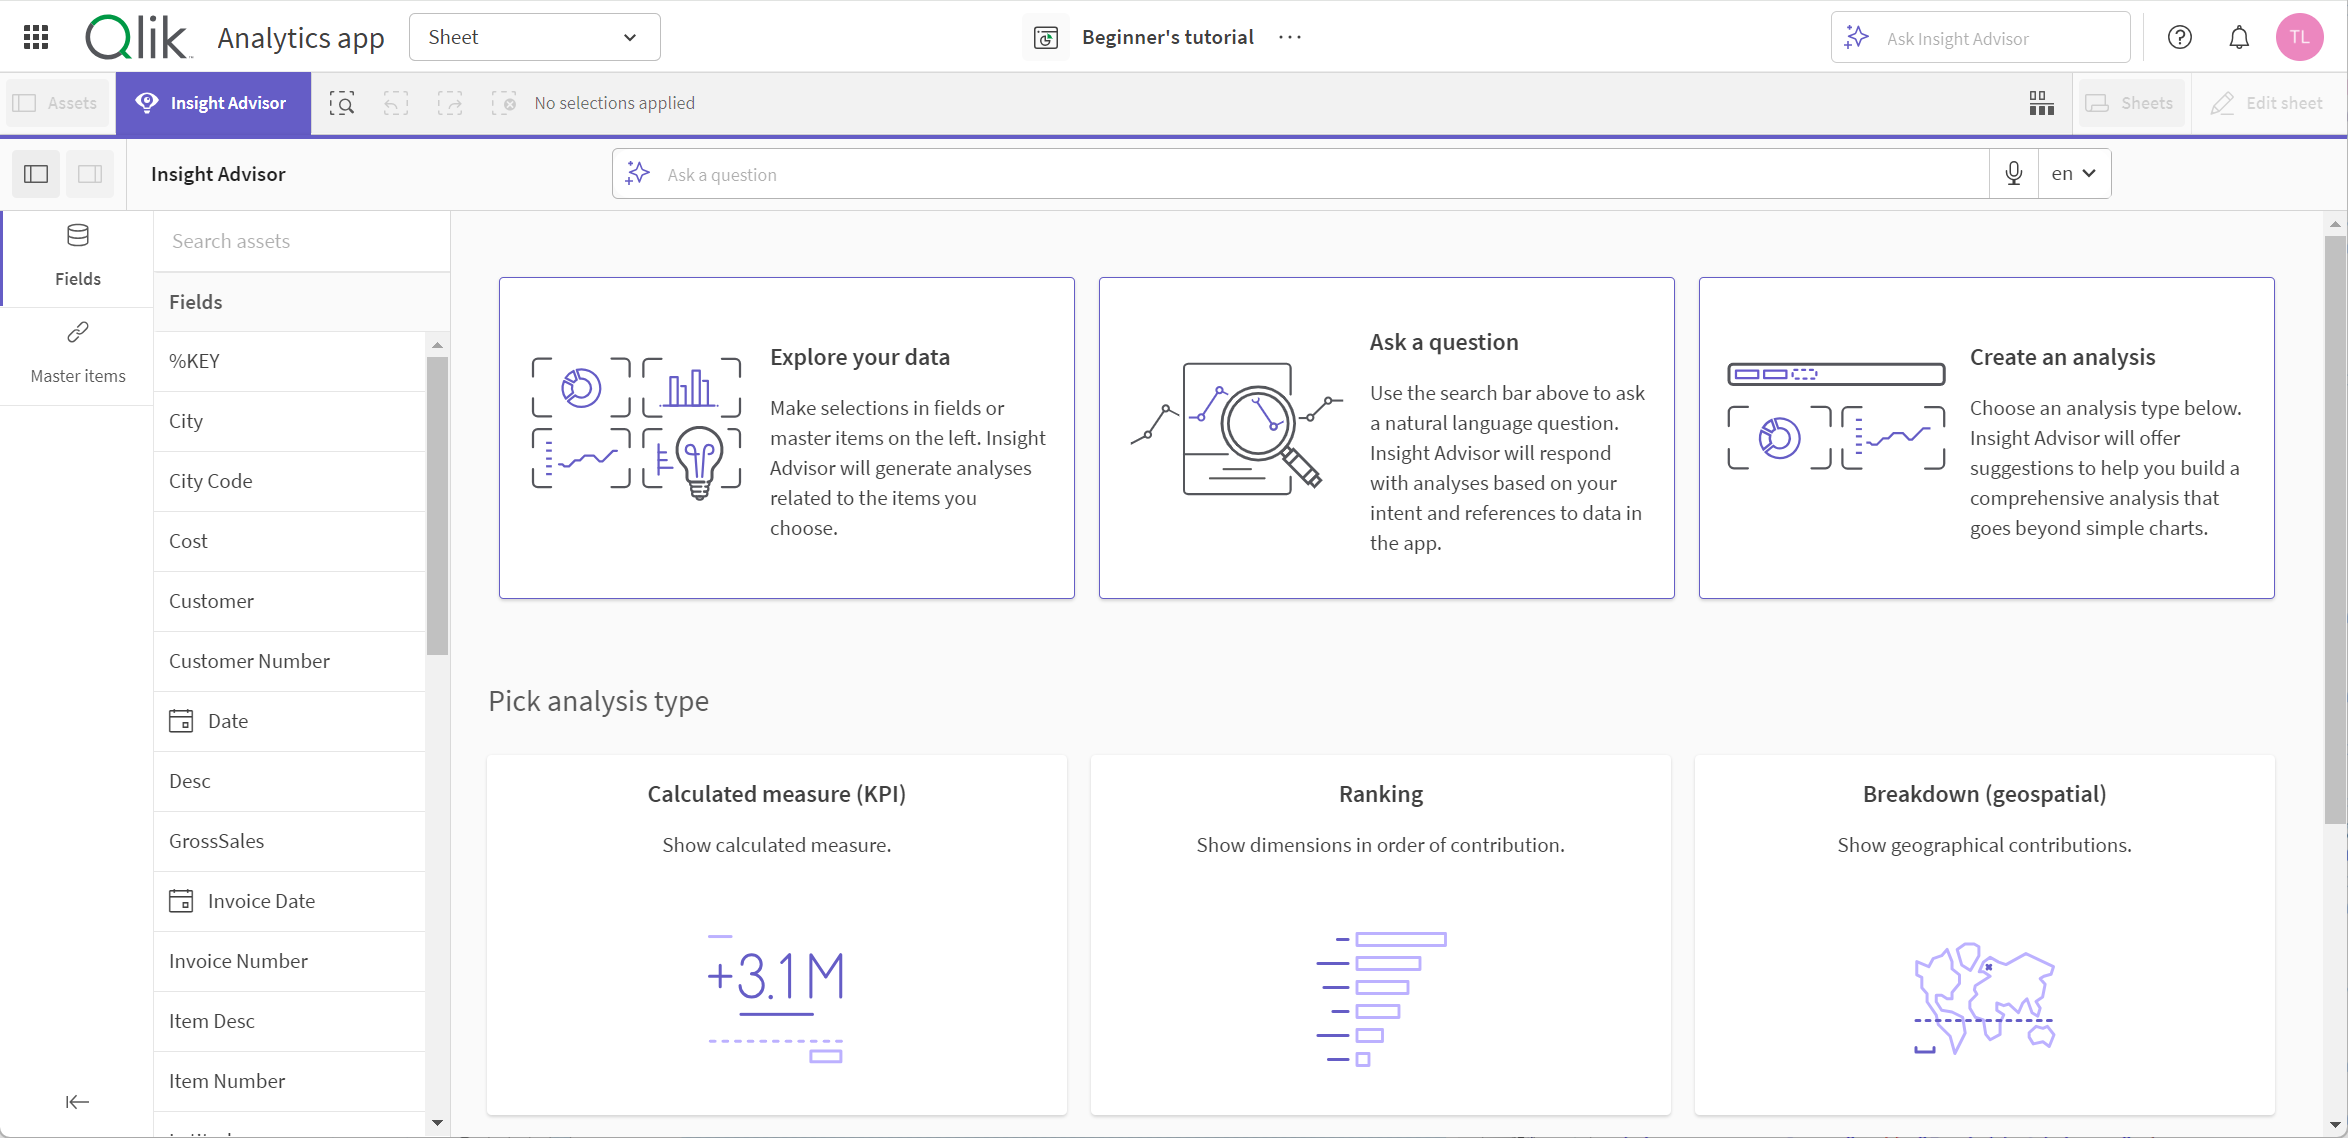
Insight Advisor
Insight Advisor helps you explore data and create analyses.
Insight Advisor uses the Qlik cognitive engine and a logical model of application data to create visualizations and analyses in an application. As an application creator, Insight Advisor helps you create application content. As a business user using apps for analysis, Insight Advisor helps you create analyses outside of what is available in the application.
For more information, see Creating visualizations with Insight Advisor.
Manage data
Load and manage data using the Data manager, the data catalog, Data load editor, and the Data model viewer.
Data manager
Add data sources and load data without using scripts in the Data manager.
Associate the data manually or based on recommendations in the Associations view. View and manipulate tables in the Tables view.
For more information, see Data manager.

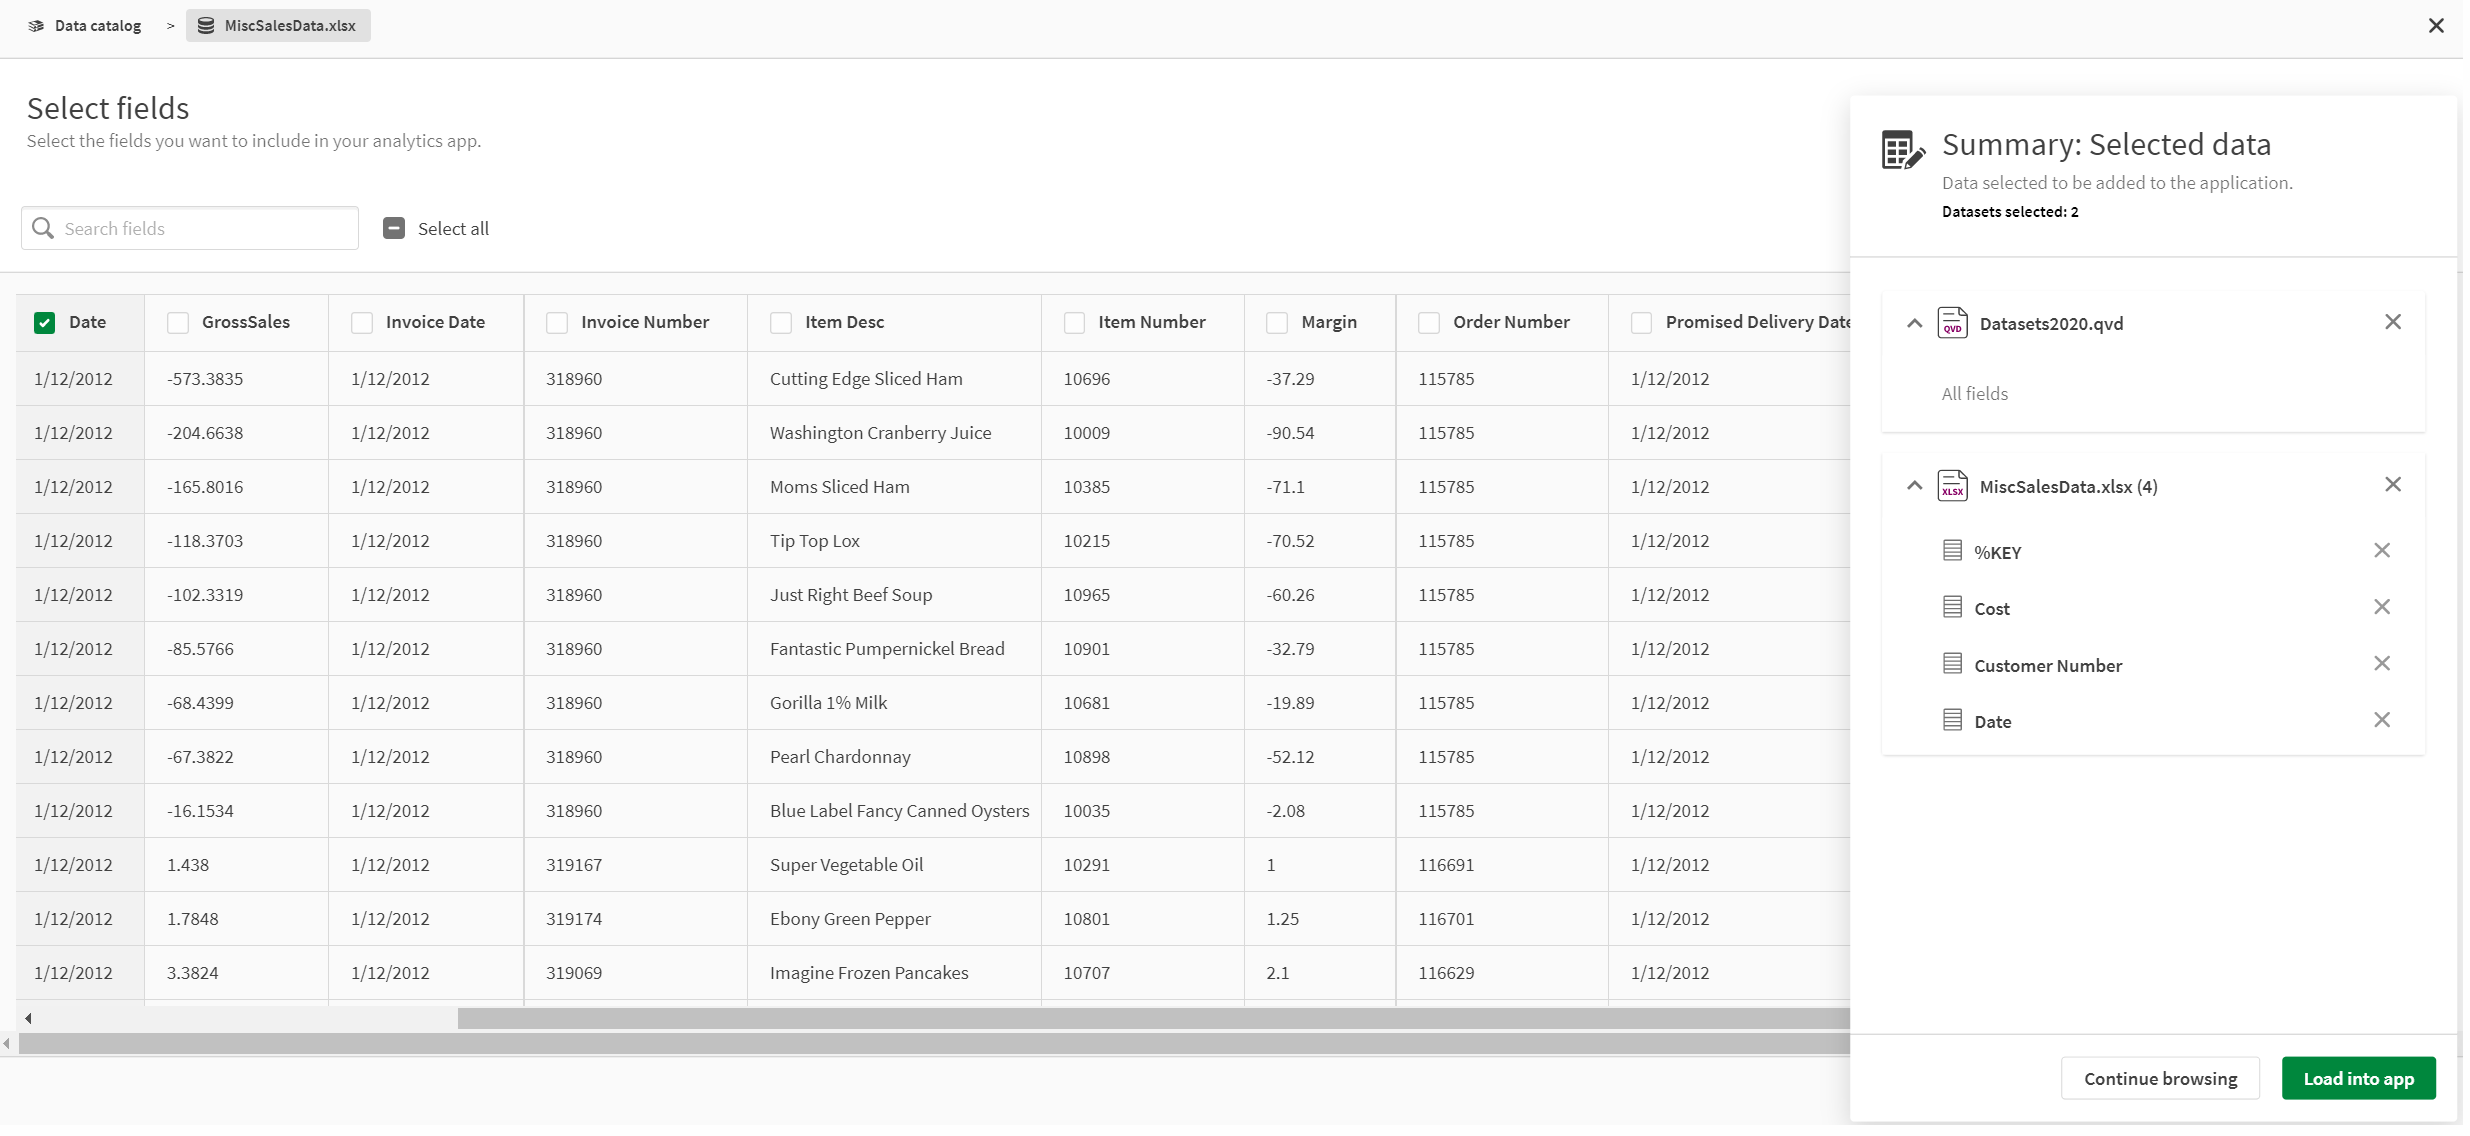
Data catalog
Use the data catalog to load data from the files that you have access to.
View and select data to load from all the data files to which you have access. Associate and manipulate the data in Data manager or Data load editor.
For more information, see Loading data from the data catalog.
Data load editor
Load data using scripts in the Data load editor.
You can edit a script manually, or it can be generated by the Data manager. If you need to use complex script statements, you need to edit them manually.
For more information, see Data load editor.

Data model viewer
See the data structure of the data that you have added to your application in the Data model viewer.
Preview data and view metadata for a table or a field and create dimensions and measures from fields.
For more information, see Data model viewer.

Reporting
You can configure enterprise report output to be generated from the application.
Define templates and a distribution list, and create filters and report tasks. These elements control what is included in the report output, who receives the reports, and how the reports are delivered. Additionally, you can activate on-demand reporting so that users can generate reports as they analyze sheets in the application.
For more information, see In-application reporting with Qlik Cloud Analytics.
