Sheet view
Sheets are components of Qlik Sense analytics apps. They present visualizations to app users so they can explore, analyze, and discover data. Sheets can be public or private. This is also where you create, design, and structure the visualizations when you build apps.
The navigation bar contains options for you to navigate in your app. The toolbar contains options to navigate your sheets, make and clear selections, and search for data. Insight Advisor is where you can access assisted creation of visualizations and analyses. The sheet is where you interact with the visualizations.
Sheet view in an app

Toolbar
The toolbar contains options to create and navigate in your sheet and app. Within the toolbar, the selections bar contains options to make selections in your data and to clear those selections, and to search for data. The selections tool also displays all selections that have been made.
Toolbar in a sheet in analysis mode
Assets
The assets panel contains options to navigate in your sheet and app. From Assets, you can navigate and create new sheets and bookmarks. You can also view and create notes, and use key driver analysis. If a report developer has activated any of the app's report templates for on-demand reporting, you can also view available templates and generate reports. Click Sheets or Bookmarks to open the assets panel to those sections.
Assets panel in analysis mode

Sheet
The sheet is where you interact with the visualizations.
Sheet in analysis mode

Options menu
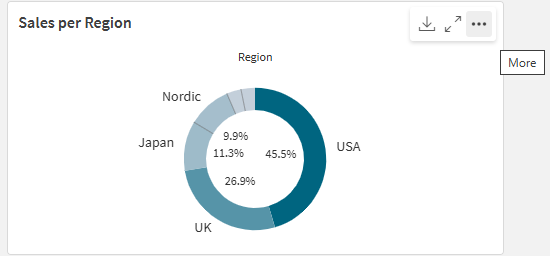
You can use the options menu to perform actions related to the visualization.
Options menu next to a chart

You can open the options menu by:
- Right-clicking on a chart.
- Clicking the hover menu
.
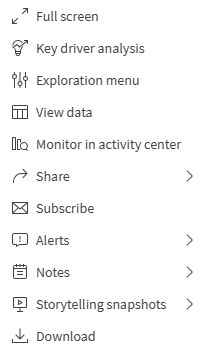
Menu options will be different depending on:
- Whether you are editing or analyzing (viewing) charts in an app.
- The chart type.
- The privileges that have been assigned to you by your administrator.
- Custom settings for visualization menus that have been configured by the app developer (see Hiding items in visualization menus).
Options menu for a chart with hover menu expanded

The menu looks different if you have touch screen mode enabled on a supported device. You can toggle touch support on and off by clicking or tapping the app navigation button () and using the toggle for
Touch screen mode.
Insight Advisor
Insight Advisor allows you to quickly create new visualizations from the data, helping you find analyses that might not be present in the app. You can access Insight Advisor by clicking Insight Advisor or, if you want to use search-based analysis, entering a query into the Ask Insight Advisor search bar.
Insight Advisor

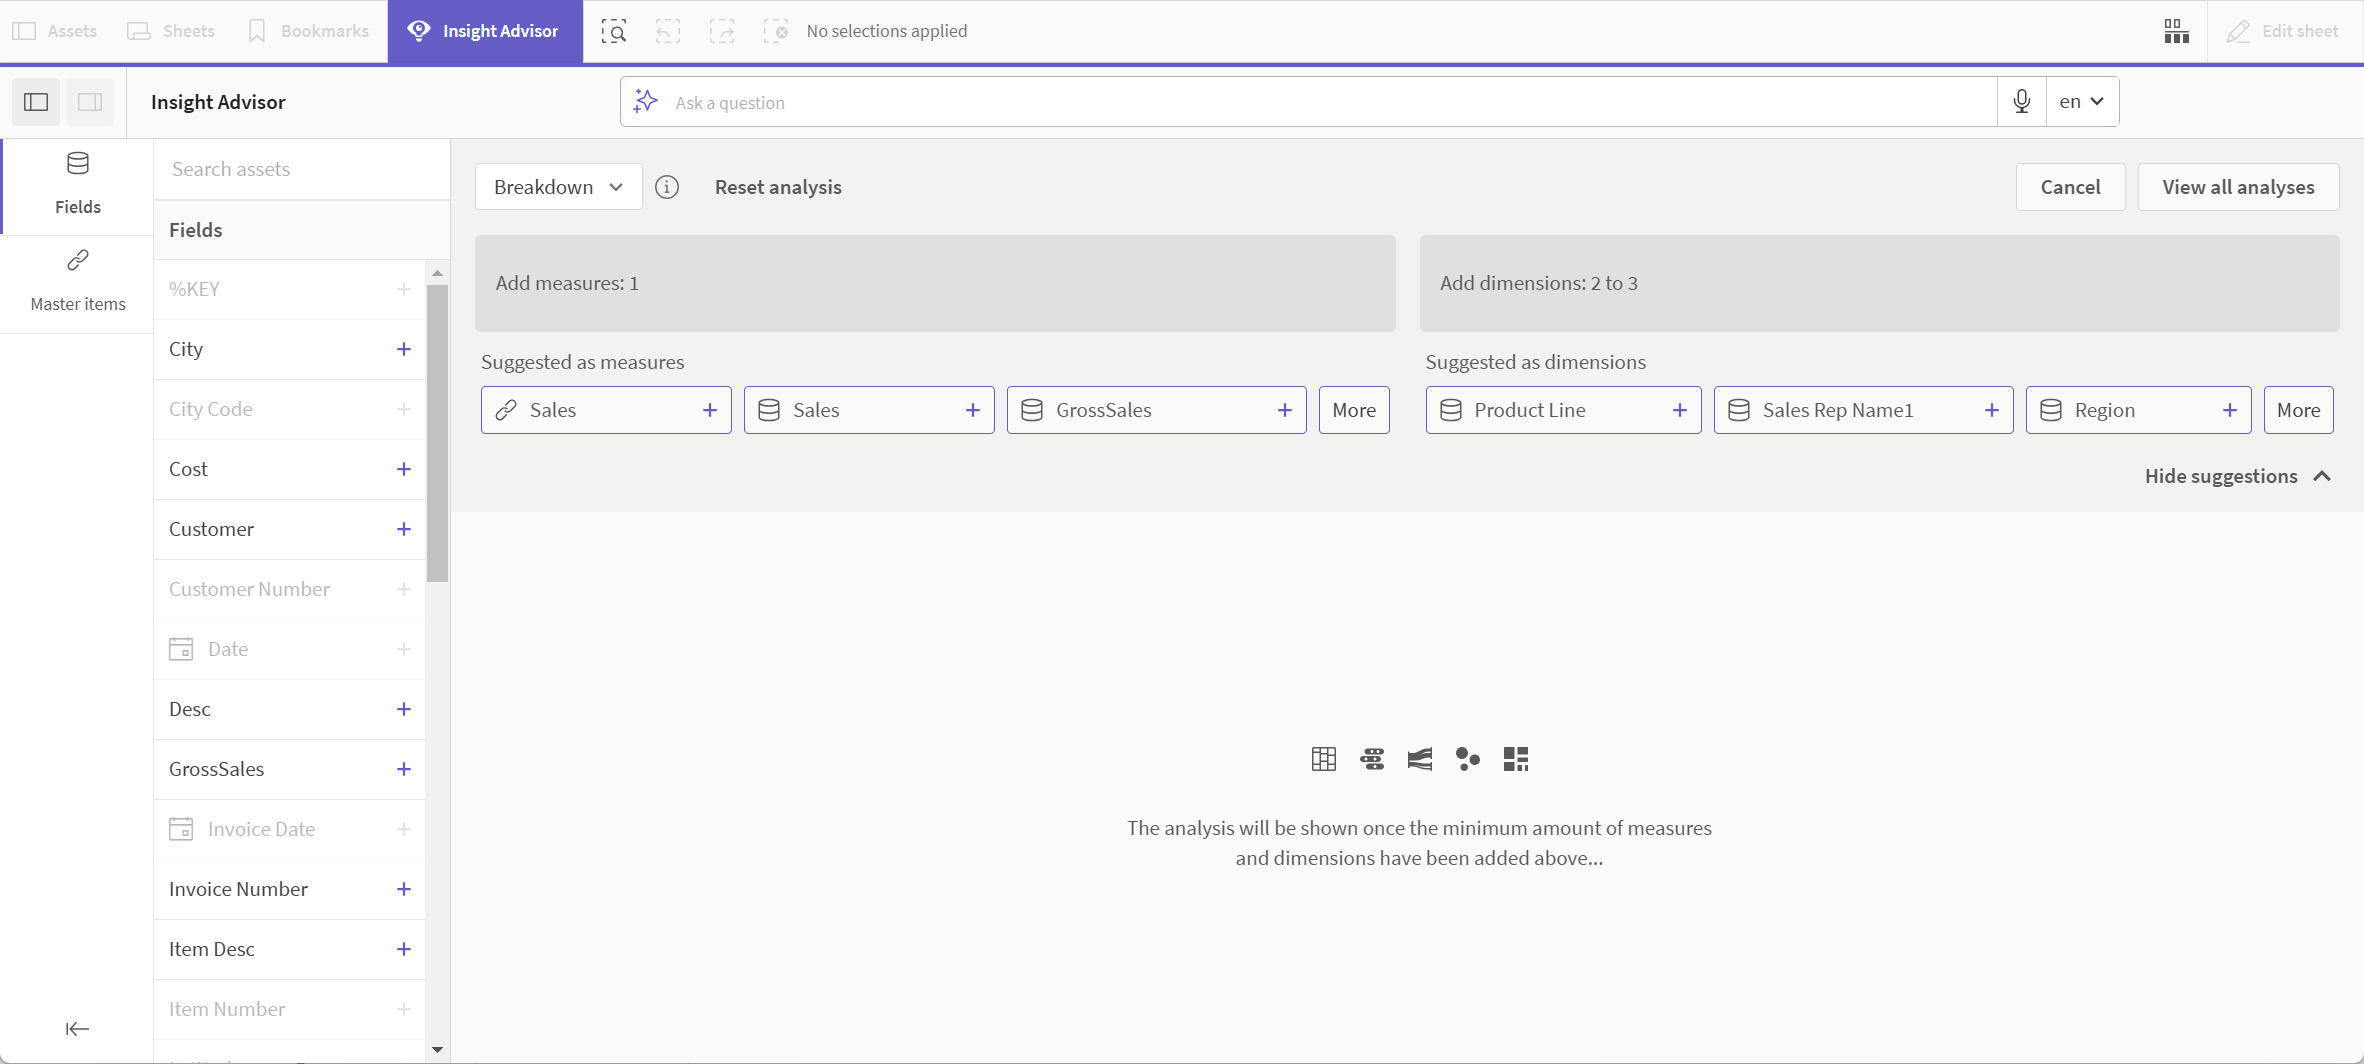
Insight Advisor Analysis Types helps you create charts from a range of possible analysis types. You select the analysis you want to see, the data types that should be used, and Insight Advisor creates charts from your parameters.
Insight Advisor Analysis Types

You can make natural language searches with Insight Advisor Search. Insight Advisor queries app data and returns results that match your question. You can also select fields and let Insight Advisor Search create charts.
If your browser is not set to a supported language, English is used.
You can change the language used by Insight Advisor by selecting a language from the Language button.
Qlik Cloud supports several languages in Insight Advisor Search. For more information on supported languages in Insight Advisor Search, see Supported languages.
If your browser is not set to a supported language, English is used. You can change the language used by Insight Advisor by selecting a language from the Language button.
Insight Advisor Search

