Analyzing impact analysis in Analytics
Impact analysis shows the forward-looking, downstream view of dependencies for a database, resource, or field. It answers questions about which databases, apps, files, links, machine learning content, and other content would directly or indirectly be impacted if the value of a field changes. For many content types, you can also drill down to the particular fields that are impacted by the change.
Qlik Cloud provides an aggregated summary of downstream impact where you can interactively examine direct and indirect dependencies of a given field or object.

Downstream lineage is called impact analysis because it analyzes which objects will be impacted by changes to your data or analytics content; these objects are the dependents of the base node. Qlik Cloud provides information and counts by type of dependent objects in a summary view.
Business users examining a given field will have an aggregated summary of downstream impact that delivers insight into:
- Which object types would be impacted by a change to this field including databases, file storage, apps, and links
- Which Power BI reports and dashboards would be impacted
- Which Qlik NPrinting or Qlik Cloud reports would be impacted
- Which data models for Power BI and Tableau would be impacted
- What is the number of direct dependencies and indirect dependencies by type
- Who are the owners of the items that are impacted if you make a change
- Which machine learning workflows would be impacted
To view upstream lineage information such as inputs, transformations, and other historical information that can explain where your data came from and what operations have acted upon it, view its lineage. See Analyzing lineage in Analytics.
To use impact analysis, you also need View lineage set to Allowed via User Default or custom security role.
Impact analysis summary view
The Impact analysis summary view
Open impact analysis from your activity center by selecting on a supported item, and then selecting Impact analysis. For some content types, you can also open impact analysis when you have the item opened. Click
and Impact analysis.
You can access lineage (upstream) or impact analysis (downstream) for other nodes that appear in graphs by selecting and then selecting Lineage or Impact analysis (new base node).
In the summary view, you can filter on whether to display all or only direct dependencies. An example of a direct dependency is an app Application A that loads a particular dataset Datafile B. In this case, Application A directly depends upon Datafile B. An example of an indirect dependency is a QVD C.qvd that is created by Application A, based on Datafile B. In this case, C.qvd is an indirect dependency of Datafile B.
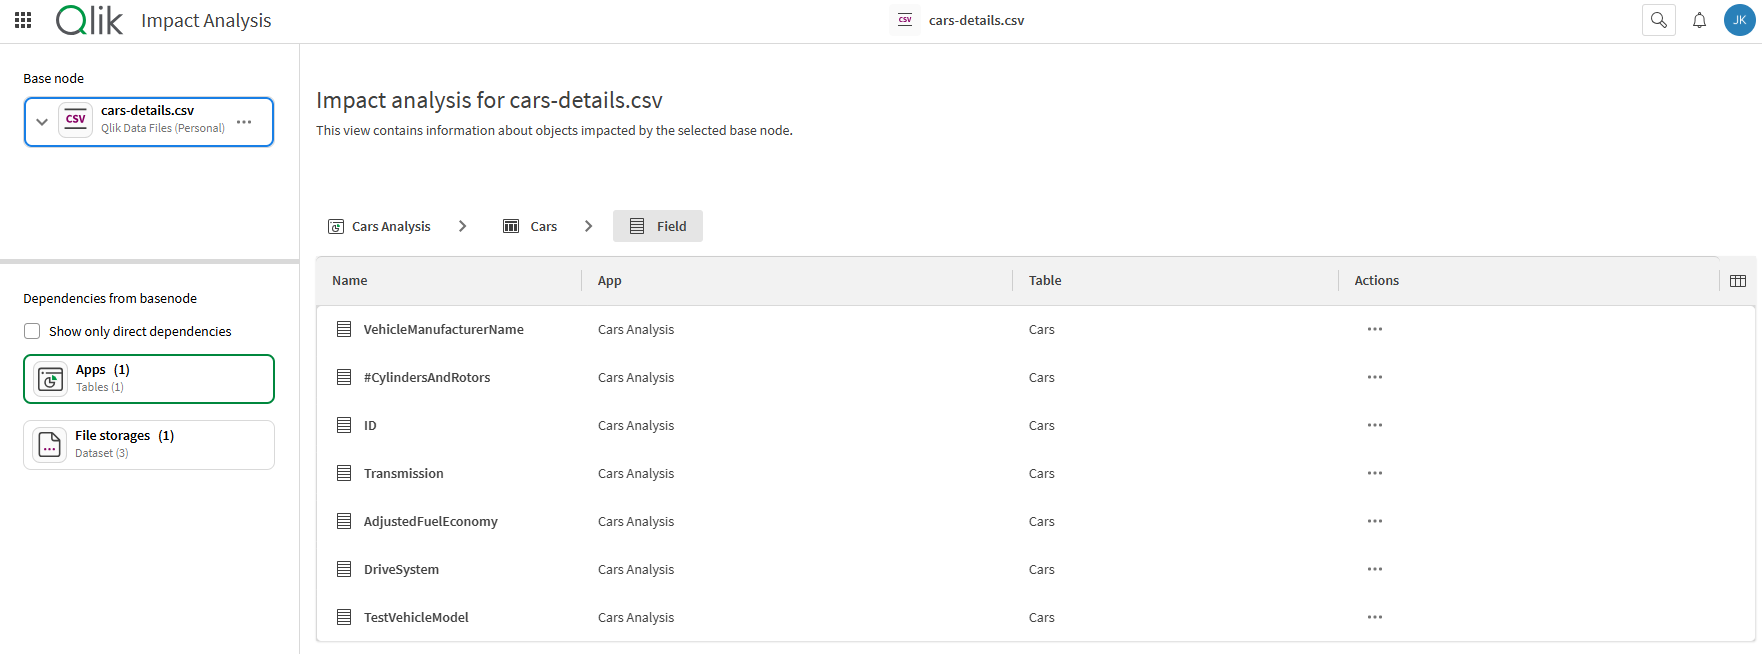
Impact analysis summary view shows dependent fields in an app

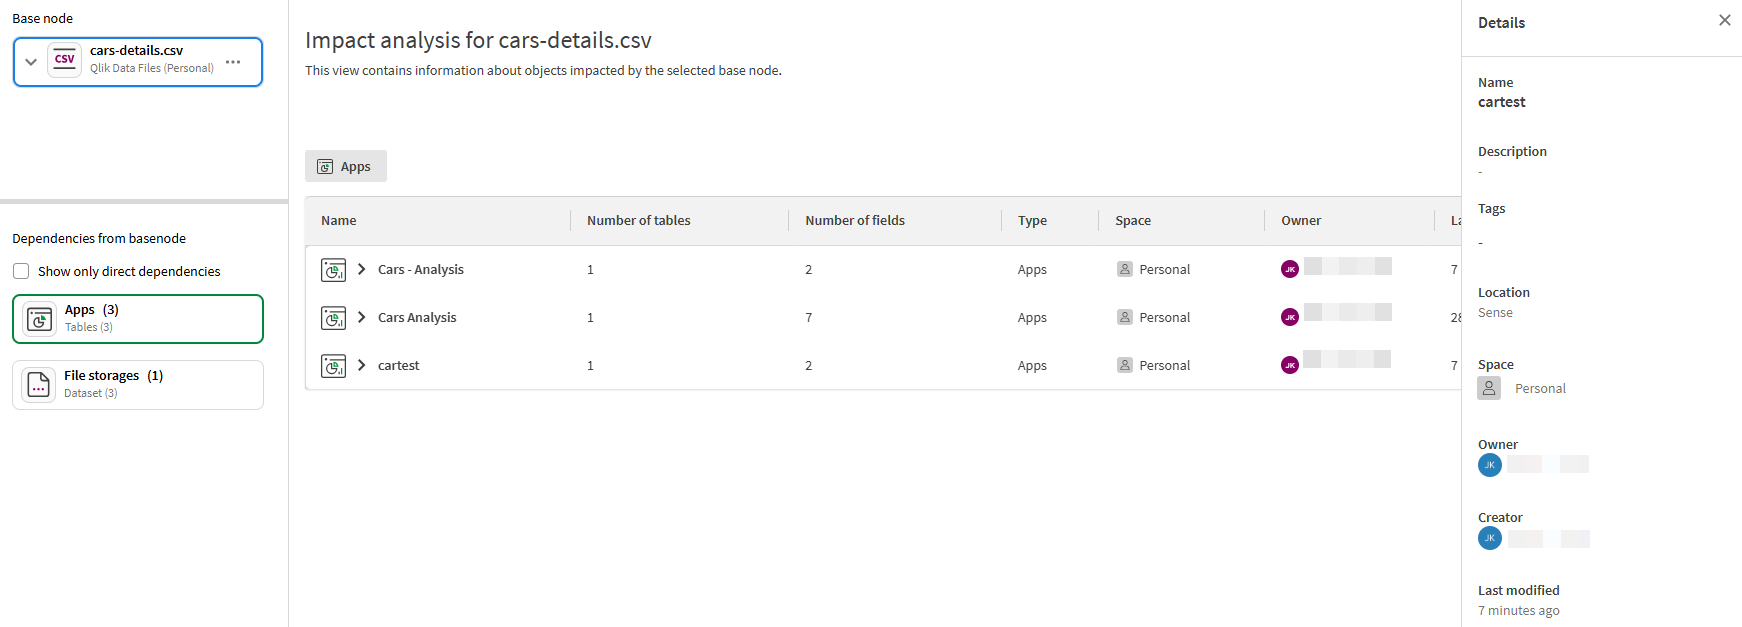
The base node being analyzed is outlined in blue. The dependents are listed in the left-hand overview with counts per type. When in focus and listed in the main grid, that type is outlined in a green box. Types of dependencies include databases, apps, file storage, databases, and links. The listed dependent objects for that type are listed in the main grid. Drill into these objects by selecting the row. For example, an app will drill down into table and then field-level.
To investigate impact of a field change, drill down from the base node object and select a field of interest to see dependencies for that field.

Select on the row of the dependent object in focus to access a menu with the following actions:
-
Details (see Node details)
-
Impact analysis (new base node)
-
Lineage (for that object)
-
Open
Actions that can be taken on dependent objects in impact analysis summary view

Accessing impact analysis from a dataset
You can also access a condensed version of the impact analysis summary view from the overview of a dataset by switching to the Impact analysis tab.
Impact analysis grid columns
Select columns of interest with the column-picker in the top-right of the grid. Column options vary depending on the type of resource being viewed. The column options may include the following headings:
-
Name
-
Number of datasets | tables | fields
-
Type
-
Space
-
Owner
-
Last reload
-
Last modified
-
Open
-
Number of models
-
Number of configurations
-
Number of versions
-
ML Deployment
Impact analysis summary grid

Node details
Details are limited by your access to that object. Details can provide the following information:
-
Name
-
Description
-
Tags
-
Location
-
Space
-
Owner
-
Creator
-
Last modified
Impact analysis summary grid

Impact analysis for machine learning content
With Impact analysis, you can identify downstream resources for your machine learning content. You can analyze ML experiments, ML deployments, and datasets in Impact analysis.
For example, you might want to identify which prediction datasets would be affected if you updated an apply dataset. You can also see how many learning resources appear as downstream dependencies for other content, such as analytics apps.
Machine learning assets are also shown in Lineage for comprehensive analysis of the origins of your predictive analytics content. For more information, see Analyzing lineage for machine learning content.
Opening Impact analysis for machine learning content
Do one of the following:
-
In your activity center, click
next to an ML experiment, ML deployment, or dataset, and select Impact analysis.
-
In an ML experiment or ML deployment, click
in the navigation bar and select Impact analysis.
Impact analysis and ML experiments
In Impact analysis, ML experiments can appear in either of the following ways:
-
As the base node of the impact analysis.
-
As upstream nodes of other processes, such as predictions or predictive apps.
With an ML experiment set as the base node, it appears in the top left corner under Base node. Select the experiment to drill down into experiment versions
. A single experiment version
can then be selected for analysis as the base node. Finally, you can drill down within the version
to find a specific model
and set it as the base node.
Downstream dependencies for the experiment, or elements within it, include ML deployments, datasets, and analytics content such as apps, scripts, and data flows.
An ML experiment can also appear in the summary view when upstream content (for example, a dataset) is selected as the base node. When you have selected an experiment under Dependencies from basenode in the left panel, you can drill down within the experiment to show more information in the grid. An experiment drills down into one or more versions
. An experiment version
drills down into one or more models
.
Impact analysis and ML deployments
In Impact analysis, ML deployments can appear in either of the following ways:
-
As the base node of the impact analysis.
-
As upstream nodes of other processes, such as predictions or predictive apps.
With an ML deployment set as the base node, it appears in the top left corner under Base node. Select the deployment to drill down into deployed models. A single model
can then be selected for analysis as the base node. Finally, you can drill down within the model to find a prediction output node. With the output node set as the base node, you can use the dependency grid to view a list of generated prediction datasets.
Downstream dependencies for the deployment, or elements within it, include datasets, and analytics content such as apps, scripts, and data flows.
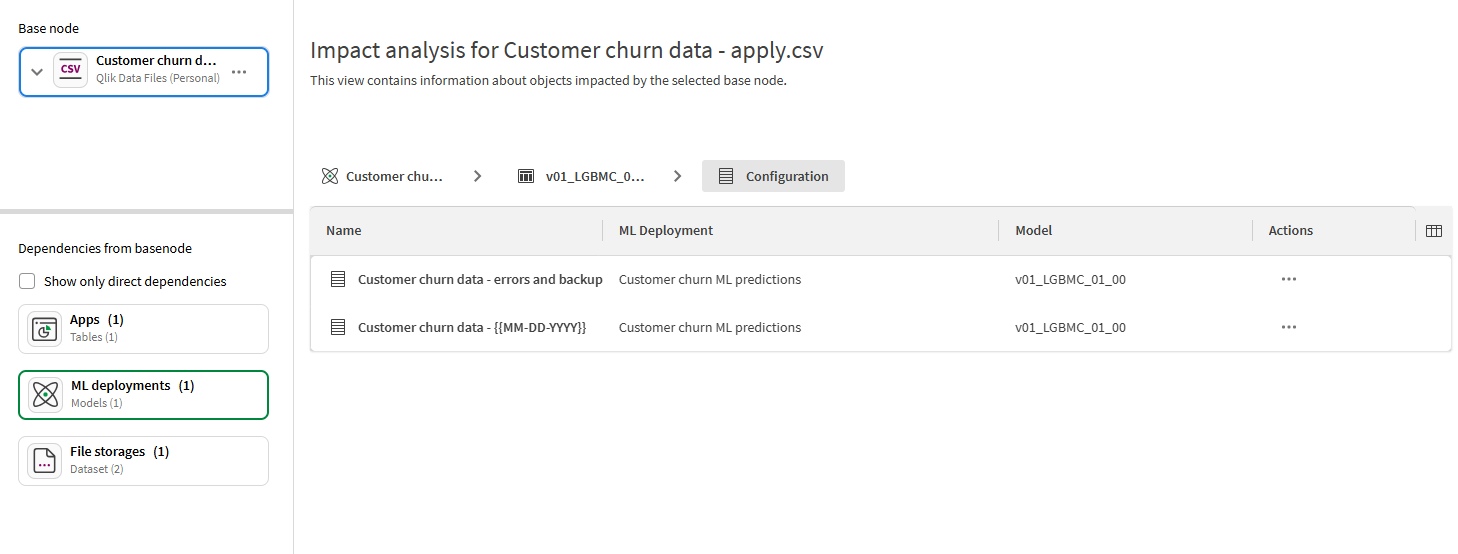
An ML deployment can also appear in the impact analysis summary view when upstream content (for example, an ML experiment) is selected as the base node. When you have selected a deployment under Dependencies from basenode in the left panel, you can drill down within the deployment to show more information in the grid. A deployment drills down into one or more models
. A model
drills down into one or more Configuration
items, with each item representing a generated prediction dataset. These datasets can be analyzed individually by setting them as a base node.
Impact analysis and ML datasets
ML datasets are datasets that are used in or created by ML experiments and ML deployments. They include:
-
Datasets exported from embedded analytics in an ML experiment (Compare and Analyze tabs)
-
Prediction datasets
With an ML dataset set as the base node, it appears in the top left corner under Base node. Select the dataset to drill down into individual fields.
An ML dataset can also appear in the impact analysis summary view when upstream content (for example, an ML experiment or ML deployment) is selected as the base node. When you have selected a dataset in the grid, you can drill down within the dataset to show field-level information.
Deleted content
If an ML experiment, ML deployment, or dataset used in machine learning processes is deleted, it is still shown in the Impact analysis summary view when analyzing other nodes.
Permissions
For information about permissions, see Permissions.
Example scenario
For an example scenario, see Example: Impact of changing a dataset used for predictions.
Permissions
Permissions for dependency analysis
Users without view permission will not be able to view dependent resource names, the Last reload column for dependent apps or the Last modified column for other resource types. Users without view permissions will also not be able to view the context menu or drill-in options for the resource.
Permissions when an app, script, data flow, or dataset is the base node
You must be able to view an app, script, data flow, or dataset to open Impact analysis for the item from your activity center , as well as to set the item as the base node in other ways. As stated in Permissions for dependency analysis, dependent resources are shown with limited information if you do not have view access to the resources.
Permissions for ML experiments and ML deployments
If you have the following, you can directly open Impact analysis from the ML experiment or ML deployment, your activity center, as well as set it as the base node in other ways:
-
Professional user entitlement (applies only to user-based subscriptions).
-
Automl Experiment Contributor or Automl Deployment Contributor security role
-
For ML experiments or ML deployments in shared spaces, one of the following space roles in the shared space:
-
Owner (of the space)
-
Can manage
-
Can edit
-
Can view
-
-
For ML experiments or ML deployments in managed spaces, one of the following space roles in the managed space:
-
Owner (of the space)
-
Can manage
-
Can contribute
-
Can view
-
Can operate
-
Without the above requirements, the experiment or deployment cannot be set as the base node, and it is shown with limited information when appearing during analysis of other content.
Example use cases for analyzing impact analysis
Example: Understanding the impact of making a change to a dataset
For a walk-through of a similar following example, see:
Impact analysis use casesAs an app developer, you are responsible for a data source and are considering making a change to a dataset Sales data.xlsx by removing the field Price. The questions you have are: What will be impacted by making this change? What needs to be addressed? Who should I notify? You begin the investigation by selecting on the dataset tile and selecting Impact analysis.
Impact analysis summary view for the dataset Sales data.xlsx

Example: Impact of changing a dataset used for predictions
Suppose you are a machine learning contributor who has set up scheduled predictions from an ML deployment. You want to assess which workflows would be impacted if you change the calculation logic for a column in one of your apply datasets.
Opening the apply dataset in Impact analysis, you can identify that the following content would be affected:
-
An analytics app
-
An ML deployment, within which there is one model that uses the apply dataset
-
Several dataset outputs, which have been generated from the ML deployment on a scheduled basis
With this knowledge, you can make a more informed decision on whether to proceed with the update or create a new machine learning workflow.
Impact analysis for a machine learning apply dataset, analyzing the specific prediction datasets that would be impacted by changes to the apply dataset.

Impact analysis in Data Integration
Impact analysis is also available in Data Integration. For more information, see Analyzing impact analysis in Data Integration.
