Analyzing lineage in Analytics
Lineage tracks data and data transformations backwards to the original source. Qlik Cloud provides a detailed visual representation of the history of this flow, where you can interactively examine the upstream lineage of analytics content. Lineage is available for content such as apps, scripts, data flows, table recipes, ML experiments, ML deployments, and datasets.
When consuming an analytics app, access the lineage summary view, a representation of measures and dimensions used in a particular chart object. With this view, you can identify the source, giving you confidence that you can understand and trust what you are seeing and working with. For more information, see The in-app lineage summary view.
Business users examining a given field have a view of lineage for the field that summarizes its most important dependencies:
- Fields that are used to derive it
- Direct associations and dependencies, including owner and space
- Original source (the first known source)
To view downstream or forward-looking dependencies, you can investigate what elements would be affected by a change to the object by viewing Impact analysis. See Analyzing impact analysis in Analytics.
For a visual demo of how to use lineage, see:
To use lineage, you also need View lineage set to Allowed via User Default or custom security role.
The lineage graph
The Lineage graph shows the flow of data through analytics content in an interactive, graphical chart. A resource, table, or field is called a node in a lineage graph. When a node is the base node being investigated, it is said to be in focus and displays as the last element in the graph. At the most granular level, field-level lineage graphs show the data sources and transformations that a node is sourced from or dependent on.
Lineage graphs are useful to:
-
Data experts working with the data
-
Business specialists building apps
-
Advanced business users consuming apps
-
Users who work with machine learning models
Each node represents a step in the lineage of the selected content. This lineage information is compiled whenever an analytics asset refreshes its data. If your app, script, data flow, or table recipe has not be refreshed recently, the lineage may be incomplete or inaccurate.
Lineage is available for supported content types from the tile or row as they appear in your catalog. You can analyze lineage for the following analytics content:
-
Dataset: Datasets are data sources, such as data loaded from connectors or data files. Datasets can be tables in a database, data that is uploaded to data storage or data that is generated from an app, such as a qvd file. Datasets usually have a single table each but some, such as Excel files, can have multiple tables.
Datasets that were published from Talend Studio are indicated with
 . You can go to the Talend Management Console Job that was used to generate the dataset by clicking Open TMC Job in the dataset ... menu. For more information, see Publishing datasets and lineage to Qlik Cloud.
 -
App: App nodes represent Qlik Sense analytic apps that use the data sources in the lineage. App nodes display the app name and location of the app as Qlik Sense.
-
Script: Script nodes represent scripts created in the Script interface.
-
Data flow: Data flows can be inspected for better understanding of the data sources that they use and transform.
-
Table recipe: Table recipes can be inspected for better understanding of the data source that they use and transform.
-
ML experiment: You can understand the lineage of a machine learning experiment, which consists of the data sources that have come together to produce the training data for machine learning models.
-
ML deployment: You can understand the lineage of an ML deployment and how it is being used in predictions. Lineage for ML deployments typically consists of ML experiments, experiment versions, models, and datasets.
Typical input nodes include data sources that are used by the base node, or apps that produce datasets. Field-level lineage allows for detailed investigation into how fields have been calculated and their specific origin across transforms and applications.
The nodes available in a lineage graph are the inputs to your selected content. Select an item to designate it as the base node. Input nodes are nodes that are upstream from the base node.
Field-level lineage graph

The nodes available in a lineage graph are the inputs to your selected base node, in other words the node in focus. The base node is the singular node for which you want to retrieve lineage; for example, it could be an application, data flow, ML experiment, dataset, file, table, or field.
It will be the right-most node on your screen and outlined in blue. It is the focus of your investigation and only inputs to that base node will be presented.
While you explore the lineage, you can interactively change the base node to another table, application, field, or other item on the screen to focus your investigation.
Lineage base node

The lines connecting the nodes are edges. Edges represent the relationship of a node to another node. They represent relationships indicating associations such as a dataset that is used by an application. They can also represent data that is produced as a by-product of an application. The collection of nodes and edges together make the lineage graph.
Lineage edges represent relationships

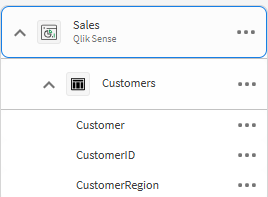
Nodes collapse or expand to reveal hierarchy levels from coarse to finer granularity beginning with the higher-level dataset group or app down to the most granular level which is the field level.
In this image of a node, the following hierarchy levels are shown, from highest (coarsest) to lowest (most granular): Data asset (app), resource (dataset), table, and fields.
Opening the lineage graph
Do the following:
-
Open the Insights or Analytics activity center.
-
Select Lineage in the context menu
on an item that supports lineage.
You can also access the lineage graph of some content when you have an item opened. Click and Lineage.
Node details
Details are limited by your access to that object. Details can provide the following information:
-
Name
-
Description
-
Tags
-
Location
-
Space
-
Owner
-
Creator
-
Last modified
Navigating the lineage graph
Click and drag the graph to navigate and center the lineage graph. You can also use the navigation buttons. Select Home to center the lineage graph on the base node. Click back and forward to move around in your selections.
Lineage graph navigation
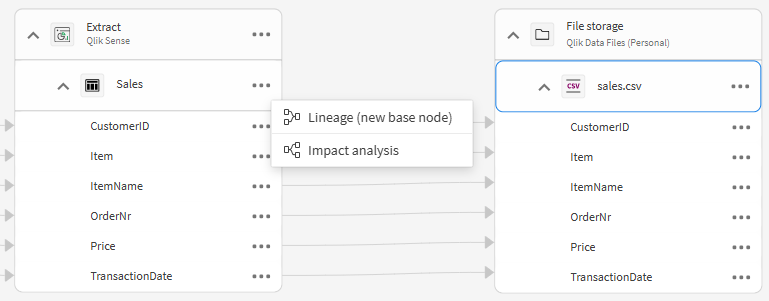
The Lineage graph shows the upstream dependencies for your analytics content, which is presented as the default node when you open the graph for it. You can access lineage (upstream) or impact analysis (downstream) for other nodes that appear in the graph by selecting and Lineage (new base node) or Impact analysis. Select a node to designate it as the base node.
Expand or collapse
the nodes to expand or collapse groups of objects at the same level.
Menu option to analyze different nodes
Lineage summary view in an app
The lineage summary view in an app can give business users a high-level overview of the upstream dependencies in the app. For more information, see The in-app lineage summary view.
Analyzing lineage for machine learning content
You can use the Lineage graph to analyze the origins of machine learning content, including ML experiments, ML deployments, and datasets. Use the graph for a holistic view of how machine learning models were created, the data they were trained on, and what they are used for in production scenarios.
Experiments, deployments, and datasets also appear as nodes when analyzing other content in the Lineage graph, such as downstream apps.
Machine learning assets are also shown in Impact analysis for comprehensive analysis of downstream content. For more information, see Analyzing impact analysis in Analytics.
Opening Lineage for machine learning content
Do one of the following:
-
In your activity center, click
next to an ML experiment, ML deployment, or dataset, and select Lineage.
-
In an ML experiment or ML deployment, click
in the navigation bar and select Lineage.
Navigating Lineage for machine learning content
You explore machine learning nodes in the same ways as for other content. For interface overviews, see:
Recognizing machine learning items in the Lineage graph
The following table outlines common items related to machine learning that appear in the Lineage graph.
| Item | Icon(s) | Explanation |
|---|---|---|
| File storage |
|
Not unique to machine learning content. Shows the location where a dataset is stored (in most cases, in a space). Relevant for training dataset, exports from embedded analytics in an experiment, apply datasets used for predictions, and prediction output datasets. |
| Dataset | Many (for example, |
Not unique to machine learning content. Used to represent training datasets, exports from embedded analytics in an experiment, apply datasets, and prediction output datasets. |
| ML experiment |
|
An ML experiment in which models are trained. |
| ML experiment version |
|
The version within the ML experiment, in which one or more models have been trained. |
| ML model |
|
An ML model trained within an experiment version. Used to represent trained models in an ML experiment, and deployed models in an ML deployment. |
| ML deployment |
|
An ML deployment that contains one or more deployed models. |
| No icon | - | Prediction output nodes within an ML deployment do not have icons. Fields included in a prediction output dataset also do not have icons. |
Lineage and ML experiments
ML experiments can appear in the following ways:
-
As the base node of a lineage graph.
-
As upstream nodes of other processes and outputs, such as predictions or predictive apps.
ML experiments are presented in grouped arrangements. They expand as follows:
-
An ML experiment expands into one or more experiment versions.
-
An experiment version expands into one or ML models.
When a model trained in an experiment is deployed into an ML deployment, it appears in the lineage graph when downstream content (for example, predictions or ML deployments) is selected as the base node.
Lineage and ML deployments
ML deployments can appear in the following ways:
-
As the base node of a lineage graph.
-
As upstream nodes of other processes, such as predictive apps, scripts, or data flows.
ML deployments are presented in grouped arrangements. They expand as follows:
-
An ML deployment expands into one or more deployed models.
-
If a model in the deployment has been used in batch predictions, the model expands to show each batch prediction output.
Field-level lineage is available for apply datasets and prediction output datasets that relate to an ML deployment.
Deployed models used for predictions are connected back to the experiment in which they were trained.
Lineage and ML datasets
ML datasets are datasets that are used in or created by ML experiments and ML deployments. They include:
-
Datasets exported from embedded analytics in an ML experiment (Compare and Analyze tabs)
-
Prediction output datasets, including prediction, SHAP, Coordinate SHAP, errors, and apply datasets
Deleted content
If an ML experiment, ML deployment, or dataset used in machine learning processes is deleted, it is still shown in the Lineage graph when analyzing other nodes.
Permissions
For information about permissions, see Permissions.
Example scenario
For an example scenario, see Example: Investigating lineage of machine learning content.
Limitations
The lineage chart has the following limitations:
-
Apps that have not been reloaded after the release of lineage in Qlik Cloud may not have full lineage information available for them until after they reload. Details for some nodes may be limited if they have not been loaded after lineage was turned on for your tenant.
-
Node details for datasets outside of your tenant, such as SQL Server or Google Drive connections, are limited to the type of dataset and name. REST connections only display that it is REST data.
Permissions
Permissions for apps, scripts, data flows, and datasets
You must be able to view an app, script, data flow, or dataset to view the lineage for the item from your activity centers. If you can see the lineage graph for a base node, you are able to see basic details and metadata for the upstream lineage objects.
Permissions for ML experiments and ML deployments
Permissions for full access
If you have the following, you can directly open Lineage from the ML experiment or ML deployment, or from your activity center:
-
Professional user entitlement (applies only to user-based subscriptions).
-
Automl Experiment Contributor or Automl Deployment Contributor security role
-
For ML experiments or ML deployments in shared spaces, one of the following space roles in the shared space:
-
Owner (of the space)
-
Can manage
-
Can edit
-
Can view
-
-
For ML experiments or ML deployments in managed spaces, one of the following space roles in the managed space:
-
Owner (of the space)
-
Can manage
-
Can contribute
-
Can view
-
Can operate
-
With this access level, you also have permissions to view details from the ML experiment or ML deployment.
Permissions for analyzing lineage
If you have the following, you can see the ML experiment or ML deployment in the Lineage graph when other content is set as the base node. You can also set the experiment or deployment as the base node for analysis.
-
Professional user entitlement (applies only to user-based subscriptions).
-
For ML experiments or ML deployments in shared spaces, one of the following space roles in the shared space:
-
Owner (of the space)
-
Can manage
-
Can edit
-
Can view
-
-
For ML experiments or ML deployments in managed spaces, one of the following space roles in the managed space:
-
Owner (of the space)
-
Can manage
-
Can contribute
-
Can view
-
Can operate
-
This access level is more limited than the full access level. If you also have the Automl Experiment Contributor or Automl Deployment Contributor security role, you will have full access and can perform other actions, such as opening them in the Lineage graph directly and viewing details.
Security
-
A user can only change to a base node that they have access to; otherwise the context menu is not available.
-
If a user has access to the base node, they will have access to see all upstream lineage.
Example use cases for analyzing lineage
For a walk-through of lineage analysis, see Field-level lineage use cases.
Example: Exploring where information comes from with the lineage summary view
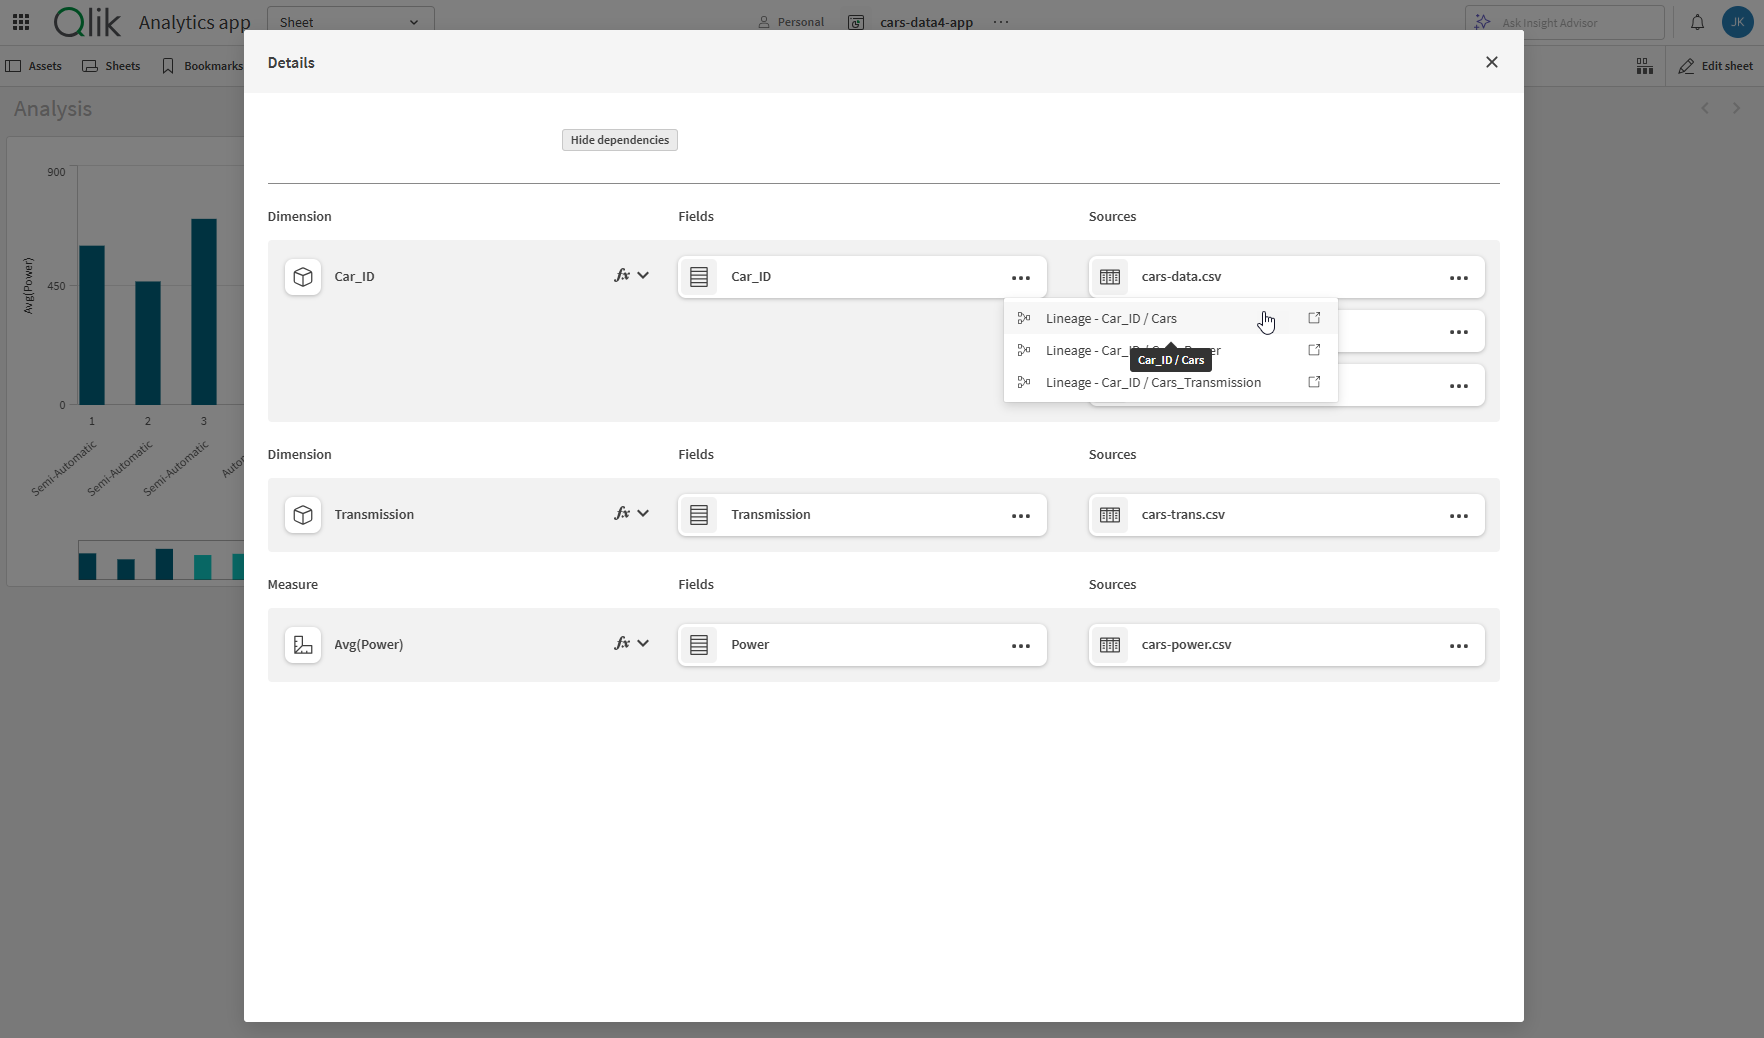
As an analytics consumer looking at a bar chart in an app cars-data4-app, you would like to know where the information comes from. You make sure that Show details and Show expressions are turned on for the chart under the Appearance > General section of properties, then select switch to sheet analysis mode. Right-click the chart, or use the menu, and select Show details to show the lineage consumer view. Click Show dependencies.
You see that the dimension Car_ID is dependent on the field Car_ID which is found in three listed CSV sources. Select the menu on the field entry and select Lineage - Car_ID / Cars to open a lineage graph for the field Car_ID in the app.
Select a source or field to view lineage for that object
The lineage graph is viewed right-to-left and shows that field Car_ID is in the table Cars that was loaded into the app cars-data4-app. Expand the nodes as you trace the field history back to the original file that was uploaded to Qlik Cloud. You see that the first relay back shows that a CSV cars-data.csv containing the field Car_ID was loaded to the app cars-data4-app. The next node back is an app cars-data3-app from which the cars-data.csv was generated. Going back one more relay and expanding the node, you see that the original source file was a CSV file cars-data3.csv and it contained the field ID.
By expanding the tables and viewing fields, you are able to identify the original source file, table, and field of the bar chart dimension Car_id-ID.
Expand the nodes to trace history of a field back to the source file

Example: Investigating the origins of a dataset and how it was created
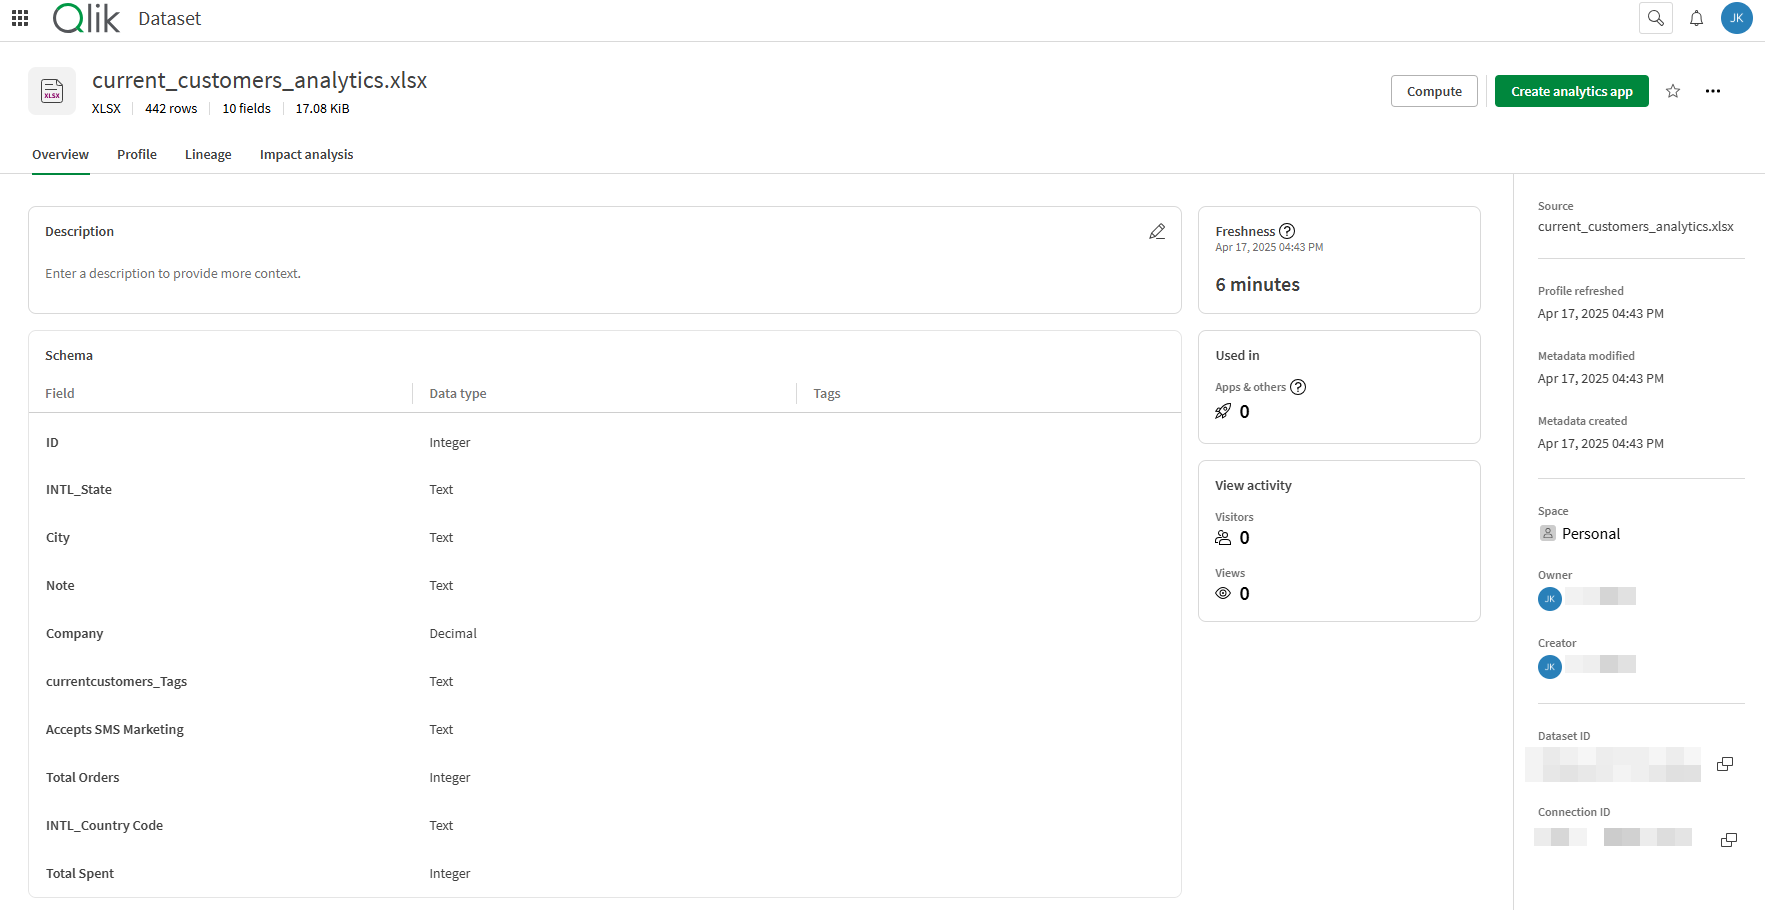
As an app developer, you are considering using an existing dataset current_customers_analytics.xlsx for your application. You investigate the origins of this dataset so that you can understand where the data comes from. From the dataset tile or the row, select Lineage from the menu to open the lineage graph. From the lineage graph, you view metadata for the dataset by selecting the
menu on the XLSX current_customers_analytics.xlsx and Open the overview.
Open dataset overview from the lineage graph

View tags, classifications, and other technical metadata from the dataset overview tab
Data profile is available from the Profile tab
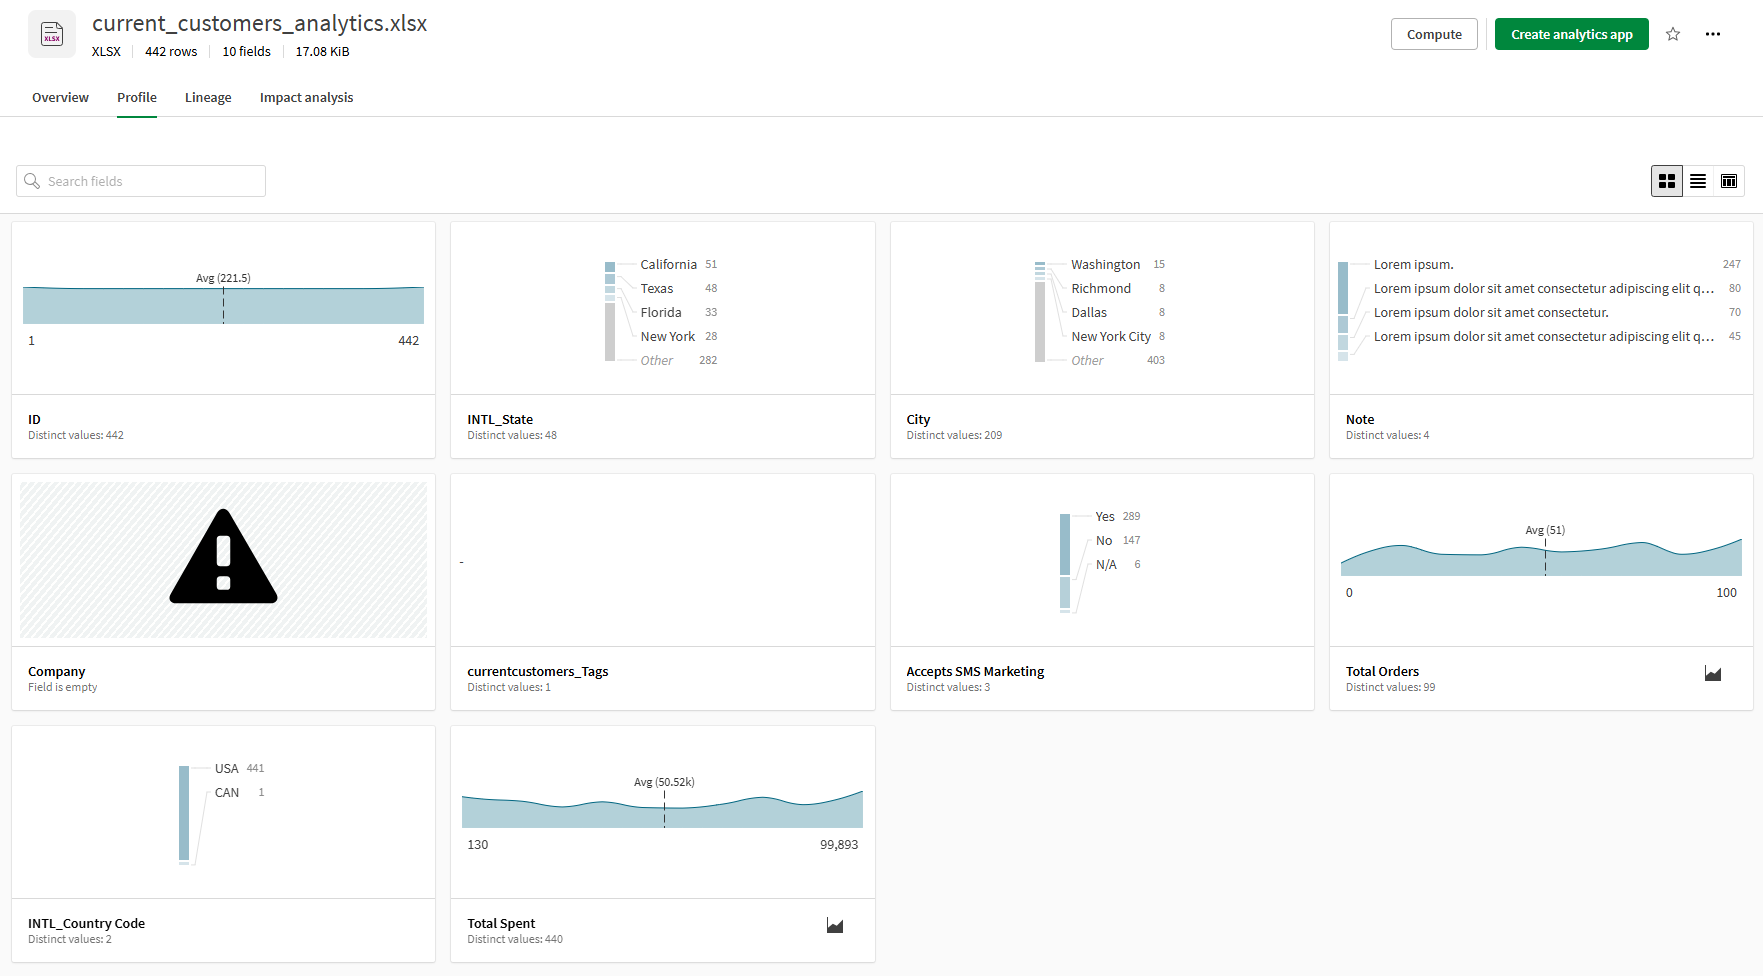
Click the browser back arrow to return to the lineage graph to explore the lineage graph for the dataset. Expand the current_customers_analytics.xlsx node, and click Select all, to view available fields. Do the same for all nodes. Note that each field provides the option to make it the base node of focus by selecting Lineage (new base node) or select Impact analysis to view forward lineage and dependent objects that will be impacted by changes to the dataset.
Expanded Lineage graph for the dataset. Each field within each node will have options to open the app or data, view impact analysis, or change the node in focus
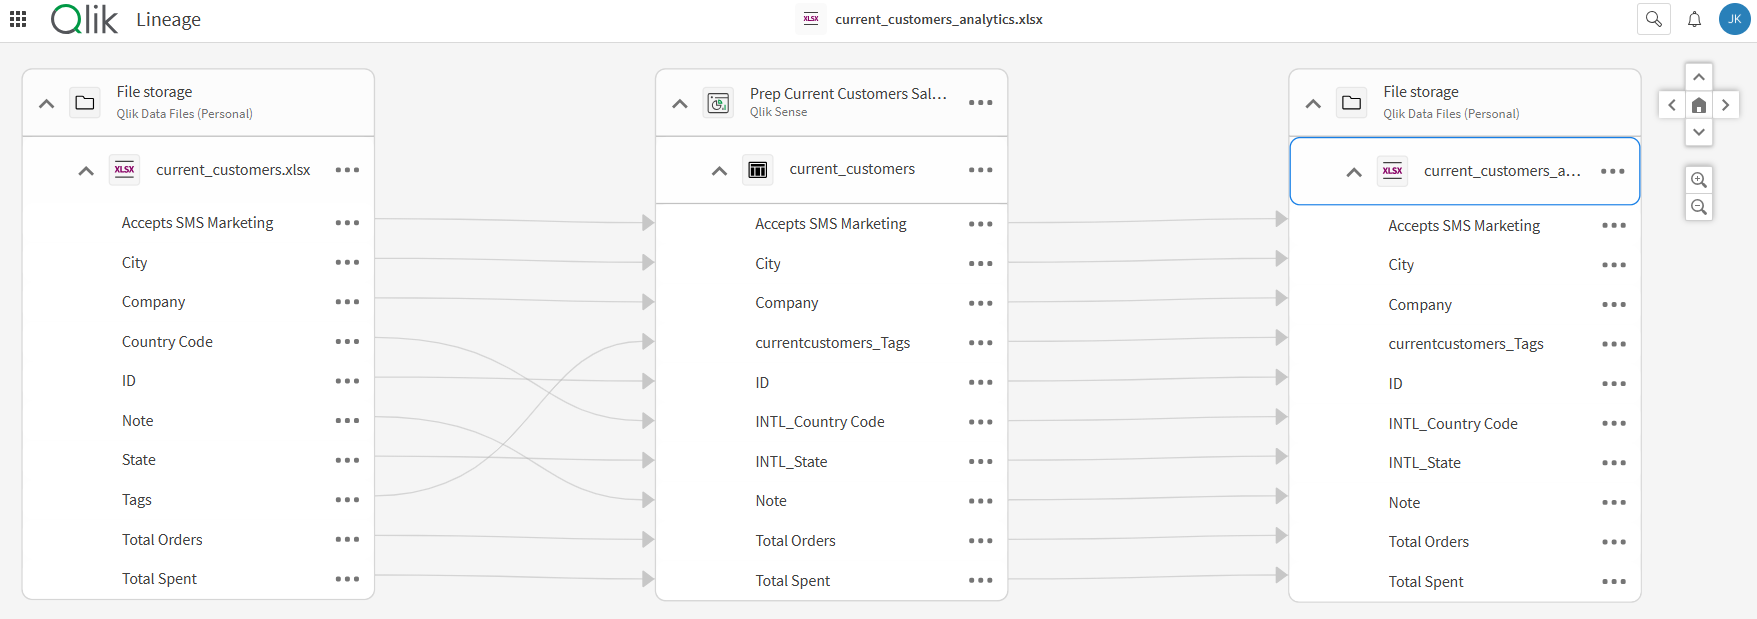
Following the lineage backwards and expanding the nodes, you can see that this XLSX dataset is the output of the Prep Current Customers Sales - Analytics app. Going back another relay and expanding the File storage node, you see that the sales analysis app had a CSV file loaded to it: rgb_customers.csv. Field-level analysis reveals that the Tags field in the original source file was re-named to rgb_customers.Tags in the sales analysis app. The original CSV file can be opened to the overview to reveal valuable metadata such as the owner, creator, usage metrics, tags, classifications, field profile, and impact analysis.
Example: Investigating lineage of machine learning content
A casual business user or machine learning expert could use the Lineage graph to inspect the origins of certain predicted values. With the base node set to the prediction dataset, this user can see:
-
The training data, including its sources and transformations
-
The experiment, experiment version, and model
-
Where the model was deployed, and how it has been used
Lineage graph with all nodes expanded. The graph shows an end-to-end flow from training data preparation to a prediction dataset.
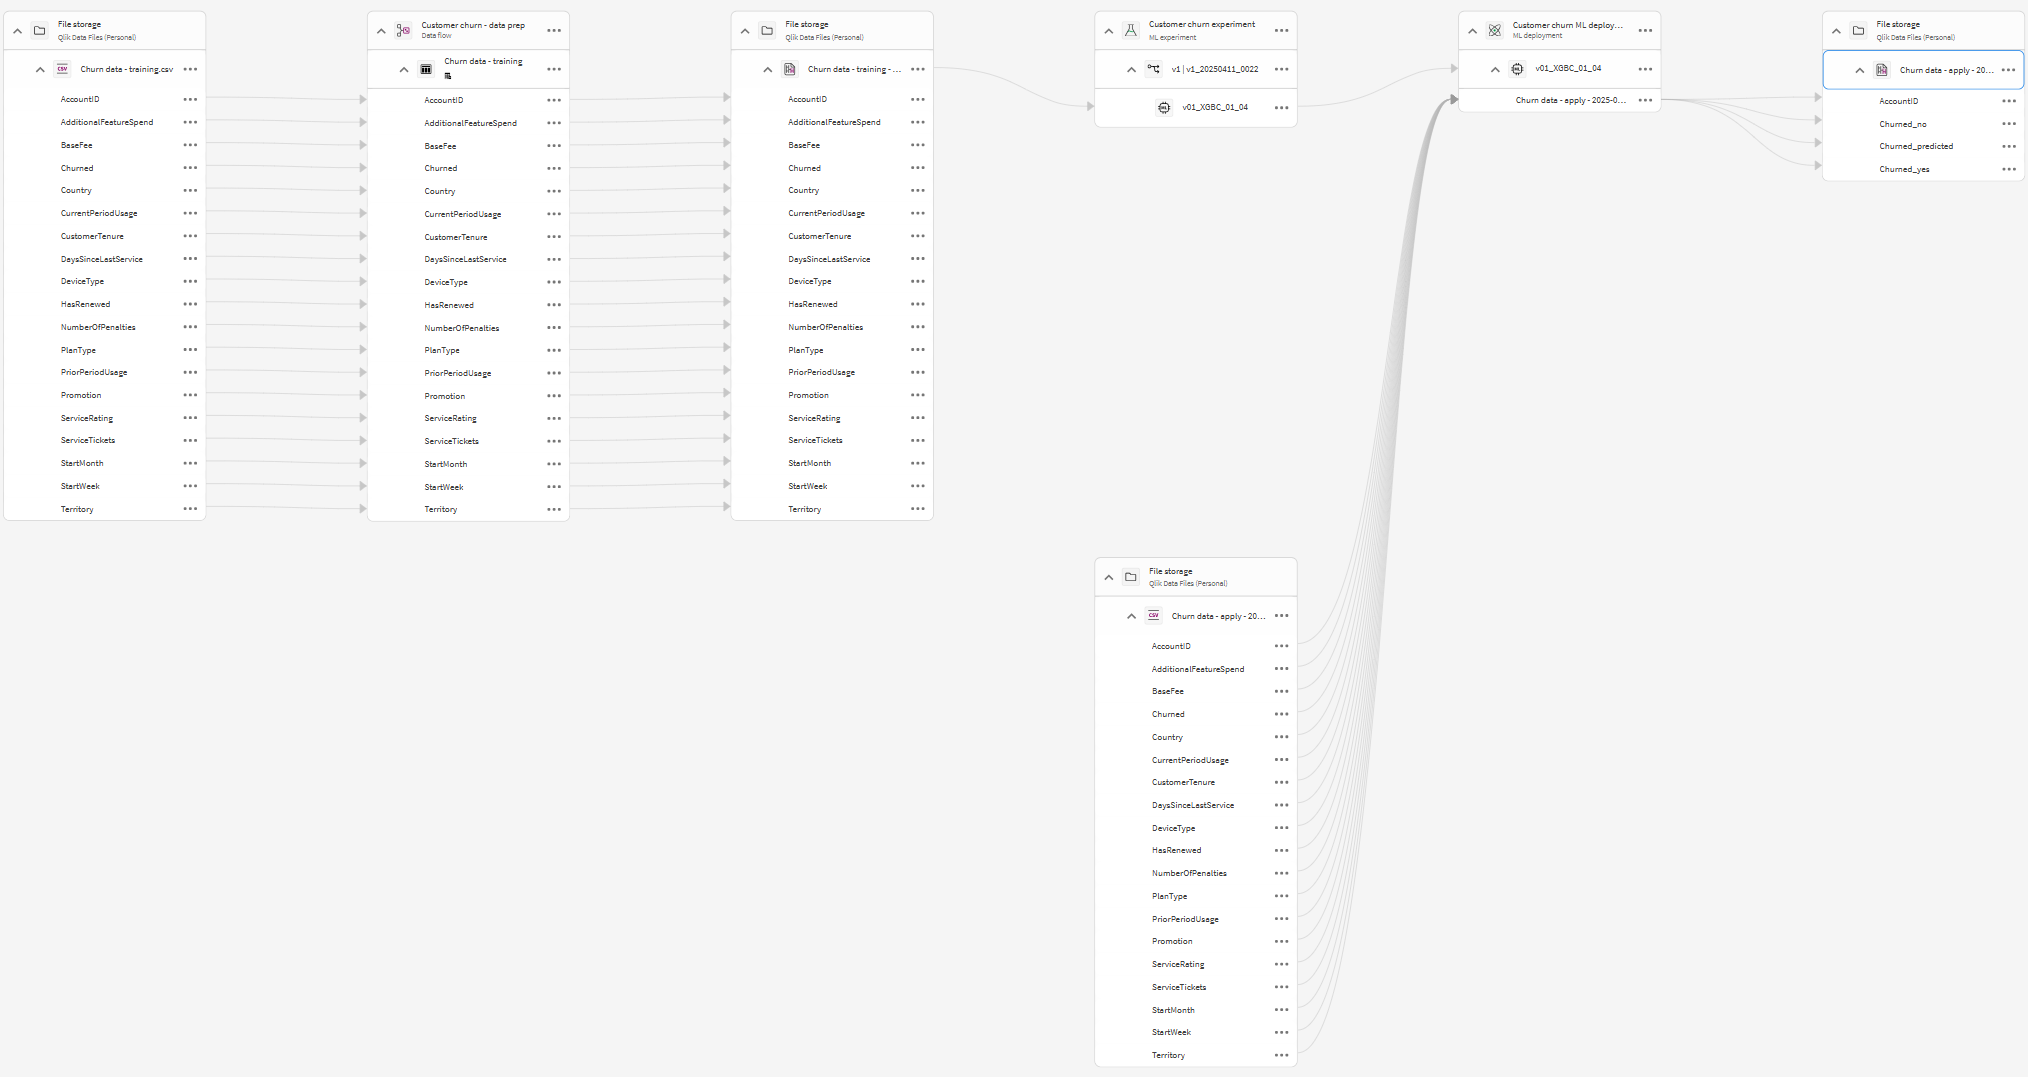
The image above shows the following process:
-
A data flow
loads and transforms data from a CSV dataset
stored in a personal space
. The output is stored into a Parquet dataset
in the same space.
-
The Parquet dataset
is used in version 1
of an ML experiment
. This experiment version trains an ML model
.
-
The ML model
is deployed into an ML deployment
.
-
Using a CSV dataset
in a personal space
as the apply dataset, the ML deployment
generates a prediction dataset in Parquet format
.
Lineage in Data Integration
The Lineage graph is also available in Data Integration. For more information, see Analyzing lineage in Data Integration.
