Using SHAP values in real-world applications
The following examples show how SHAP importance can be used in real-world applications.
Call center guidance
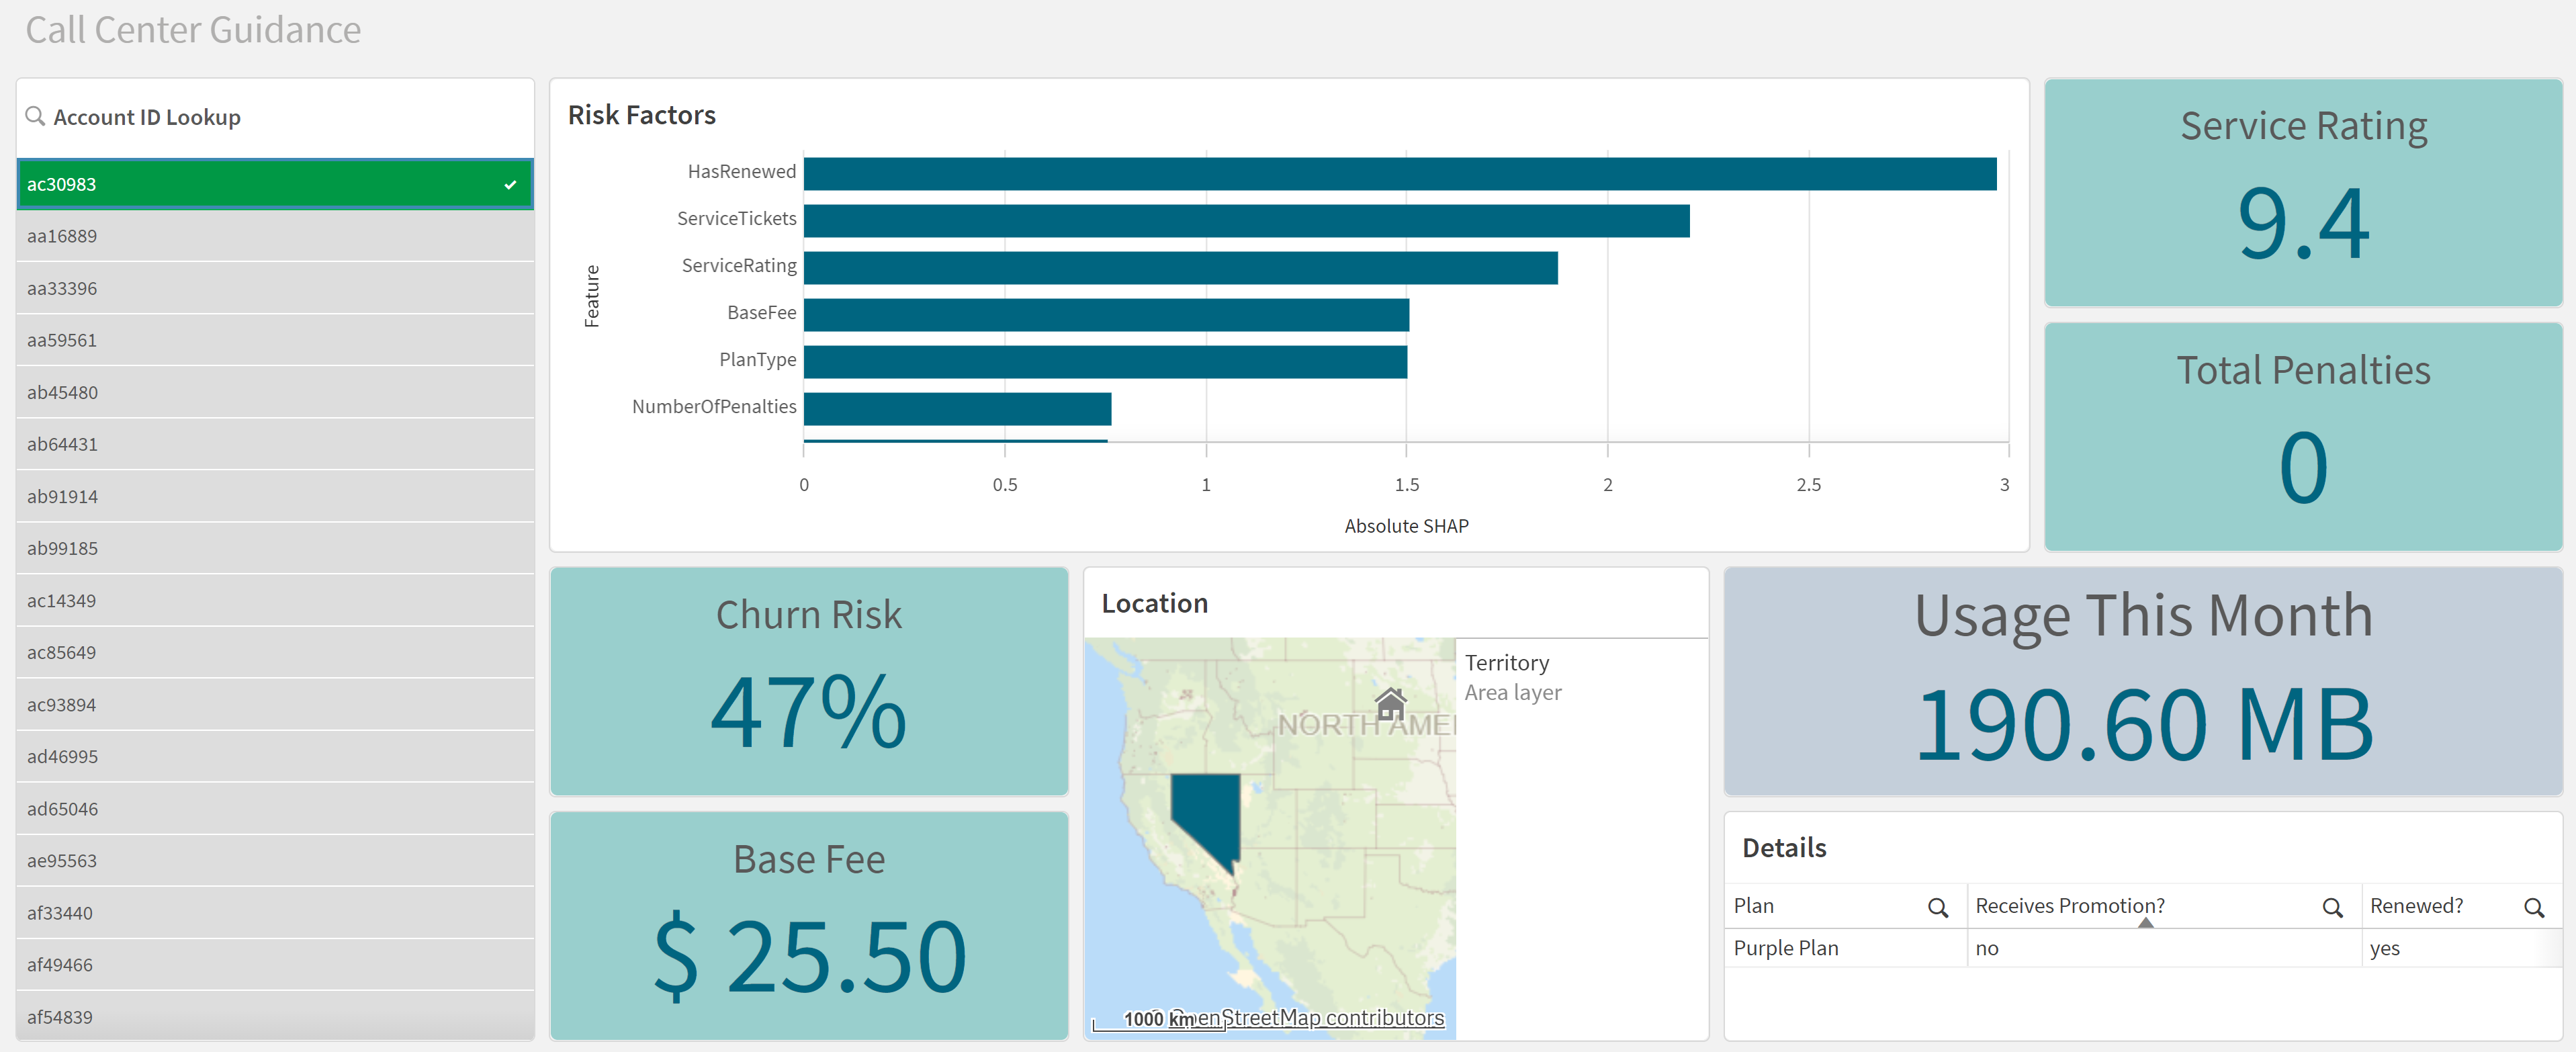
Customer service agents in a call center can use SHAP importance to understand what the most important features are for the customer who is currently calling. Based on this information, they can focus the conversation on the most effective actions. With the real-time prediction endpoint in the Machine Learning API, they can get real-time predictions on the effects of different actions for the specific customer.
The real-time predictions API is deprecated and replaced by the real-time prediction endpoint in the Machine Learning API. The functionality itself is not being deprecated. For future real-time predictions, use the real-time prediction endpoint in the Machine Learning API. For help with migrating from the real-time predictions API to the Machine Learning API, refer to the migration guide on the Qlik Cloud developer portal.
Customer experience dashboard in Qlik Sense, displaying SHAP importance of risk factors for churn

Academic success management
SHAP importance can be used to create individualized recommendations for student success. By identifying risk factors contributing to a student's likelihood of dropping out, it is possible to take specific early action to help students succeed academically.
Qlik Sense app identifying features that influence the risk of dropout for a specific student

Customer retention marketing
Cohort-specific marketing campaigns can be created by looking at SHAP importance and focusing on the most influential features for each group. One group might get the offer to "Renew your contract and guarantee access to your Gold Plan!" and another group would get "Renew your contract and lock in your discount for the next 12 months!".
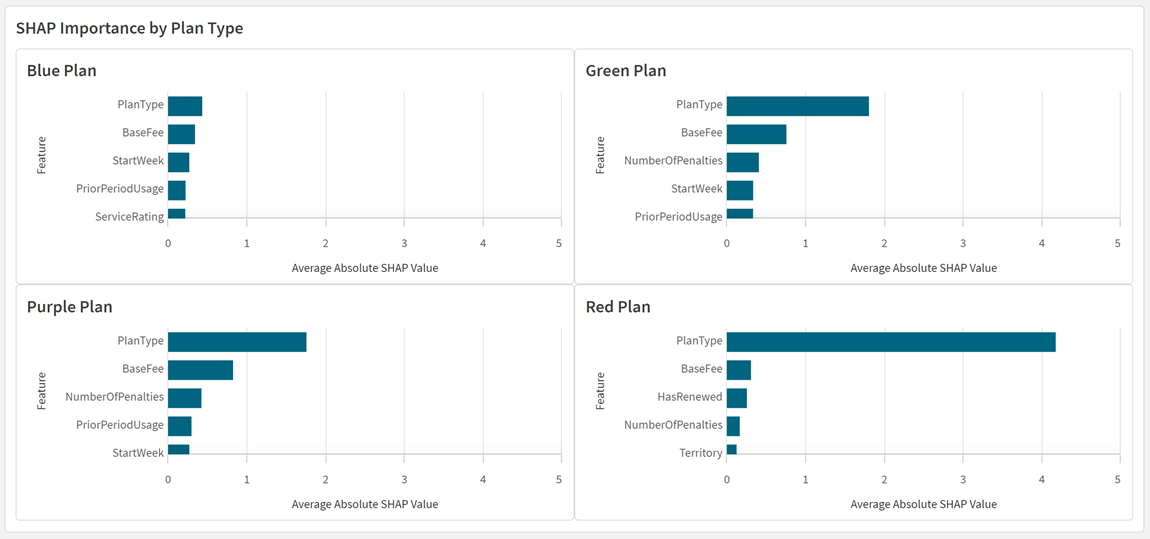
The chart below breaks down the most significant features contributing to churn predictions for each plan type offered by a company.
Chart in Qlik Sense displaying most significant churn influencers by plan type

