
Monitoring tasks for refreshing data
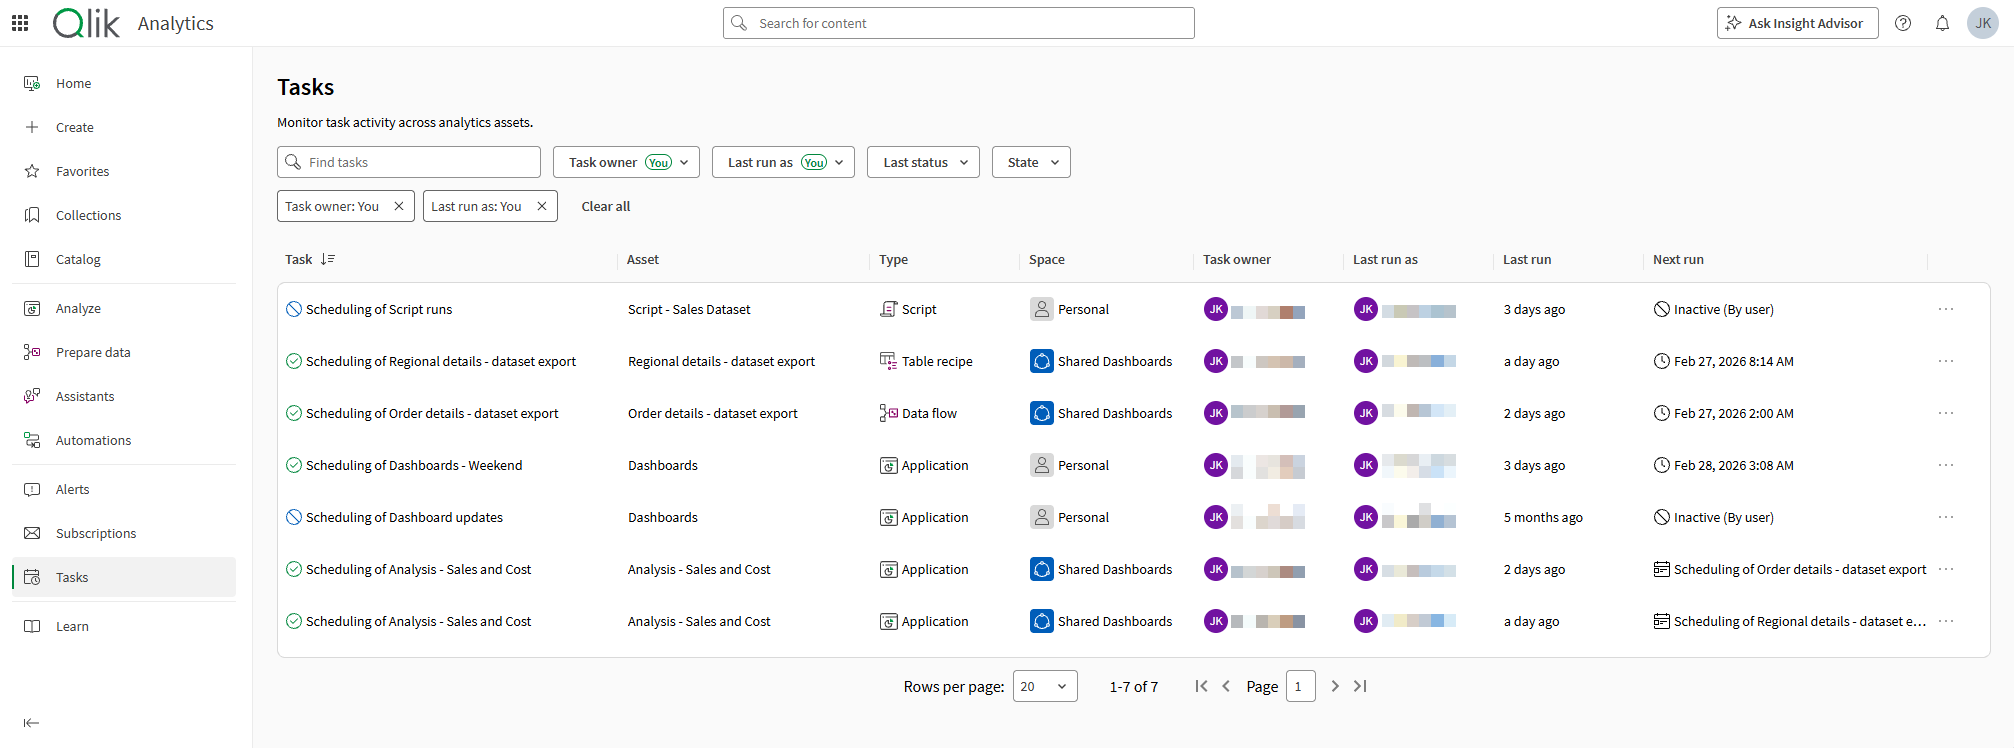
Last updated: 10/16/2026In the Tasks section of the Analytics activity center, you can monitor tasks for refreshing the data of applications, scripts, data flows, and table recipes.
Tasks section of Analytics activity center.
What you can do
In the Tasks section of the Analytics activity center, you can:
-
See all tasks for assets you can access.
-
Monitor ongoing task runs.
-
Activate and deactivate tasks.
-
Delete tasks.
-
View and manage existing task chains.
-
Filter tasks by owner, user on behalf of whom tasks have run, last status, and current state.
-
Search for tasks by name.
-
View details about when tasks have last run, when they run next, or dependencies between chained reload tasks.
-
Sort on task name and last run.
-
Click
 next to column names to access more column options. Click Hide column to hide the selected column, or Manage columns to add and remove other columns containing more information.
To further manage these tasks, click > Reload/Run > Schedule on the asset from the catalog. See Managing tasks for data refreshes.
Viewing tasks
Do the following:
-
In the Analytics activity center, open the Tasks section from the side panel.
Viewing and managing task chains
Do the following:
-
In the Analytics activity center, open the Tasks section from the side panel.
-
Next to a task that is part of a chain, click
 .
.This button will not be available if the task is not currently part of a chain. To learn about creating task chains, see Creating task chains for data refreshes.
-
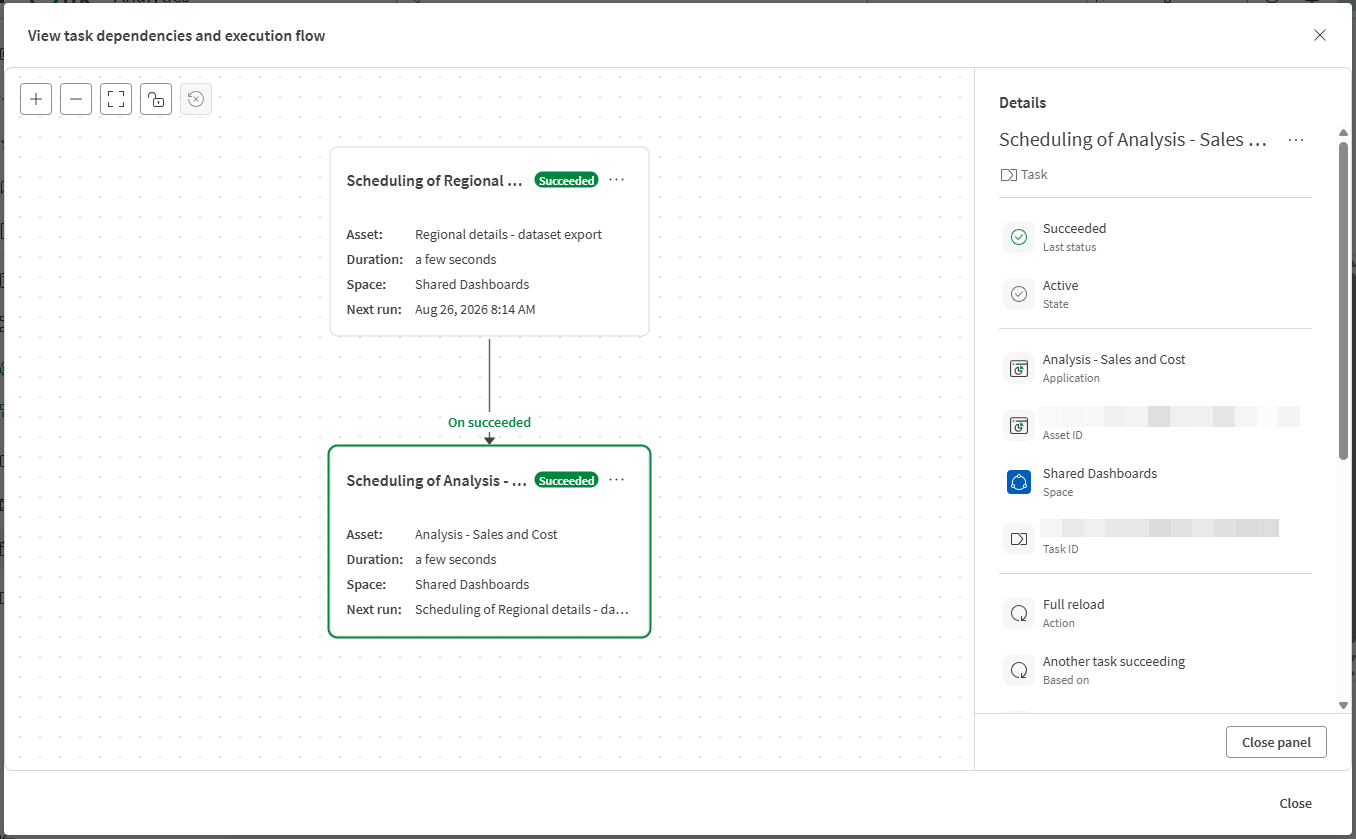
The task dependencies graph opens.
Navigating the task dependencies graph
The task dependencies graph helps to visualize the tasks that make up a task chain. Each card in the graph represents a task that is part of the chain. The task you have selected to analyze is highlighted in green. The task card also indicates the status of the last run of the task: whether it succeeded or failed.
In the task dependencies graph, you can assess the upstream and downstream dependencies between a task and the other tasks in a chain.
If there are many tasks in the chain, you might need to click Show upstream and Show downstream to view the entire chain in full.
The graph can only provide full details about tasks for analytics assets you can access. If you do not have access to a task in a chain, the dependency is shown but you cannot view or manage the task, nor can you set it as the anchor in the graph. For more information, see Permissions and access.
Navigate the task dependencies graph as follows:
-
Links between each task indicate the dependency type. Options can be:
-
On succeeded: The downstream task runs when the upstream task succeeds.
-
On failed: The downstream task runs when the upstream task fails.
-
On finished: The downstream task runs when the upstream task finishes running, regardless of outcome.
-
-
Click
in a task card to access available actions, such as:-
View details: Access information about the task, such as the asset and space to which it belongs, event trigger details, ownership, and the time of next run.
-
Set as anchor: Center the graph on a task that is not currently the object in focus. This allows you to see other related flows that have been configured.
You can reset the anchor point to the originally selected task by clicking
 .
. -
Edit: Reconfigure the task, allowing you to chain the task to another flow, or remove it from the chain.
-
Run now: Run the task outside the schedule.
-
Activate or Deactivate: Turn automatic and scheduled executions on or off for the task.
-
Delete: Delete the task.
-
-
You can zoom in and out, and fit the items to your current view.
-
You can lock and unlock the canvas to allow or prevent scrolling.
-
If needed, you can reset the graph to its original view when you first opened it.
Analyzing a task chain in the task dependencies graph
Permissions and access
For tasks to appear in Tasks, you need to have permissions to run and manage tasks in the associated spaces where the analytics assets are located. Similarly, in the task dependencies graph, for full access to viewing and managing related tasks in a chain, you also need these permissions.
For the specific permissions that are required, see Permissions.