Navigating the experiment interface
A tabbed interface allows you to navigate between various processes in your model training experience. The various tabs, as well as the experiment configuration panel, allow you to perform numerous tasks to help you train and optimize your model.
Toolbar
The toolbar is where you can switch between the various tabs in the interface.
In the toolbar, you can also do the following:
-
Depending on which tab you are on, you can switch between your trained models.
-
Click View configuration to further modify the experiment training, review the current version, or start configuring a new version.
Toolbar in an ML experiment

Data
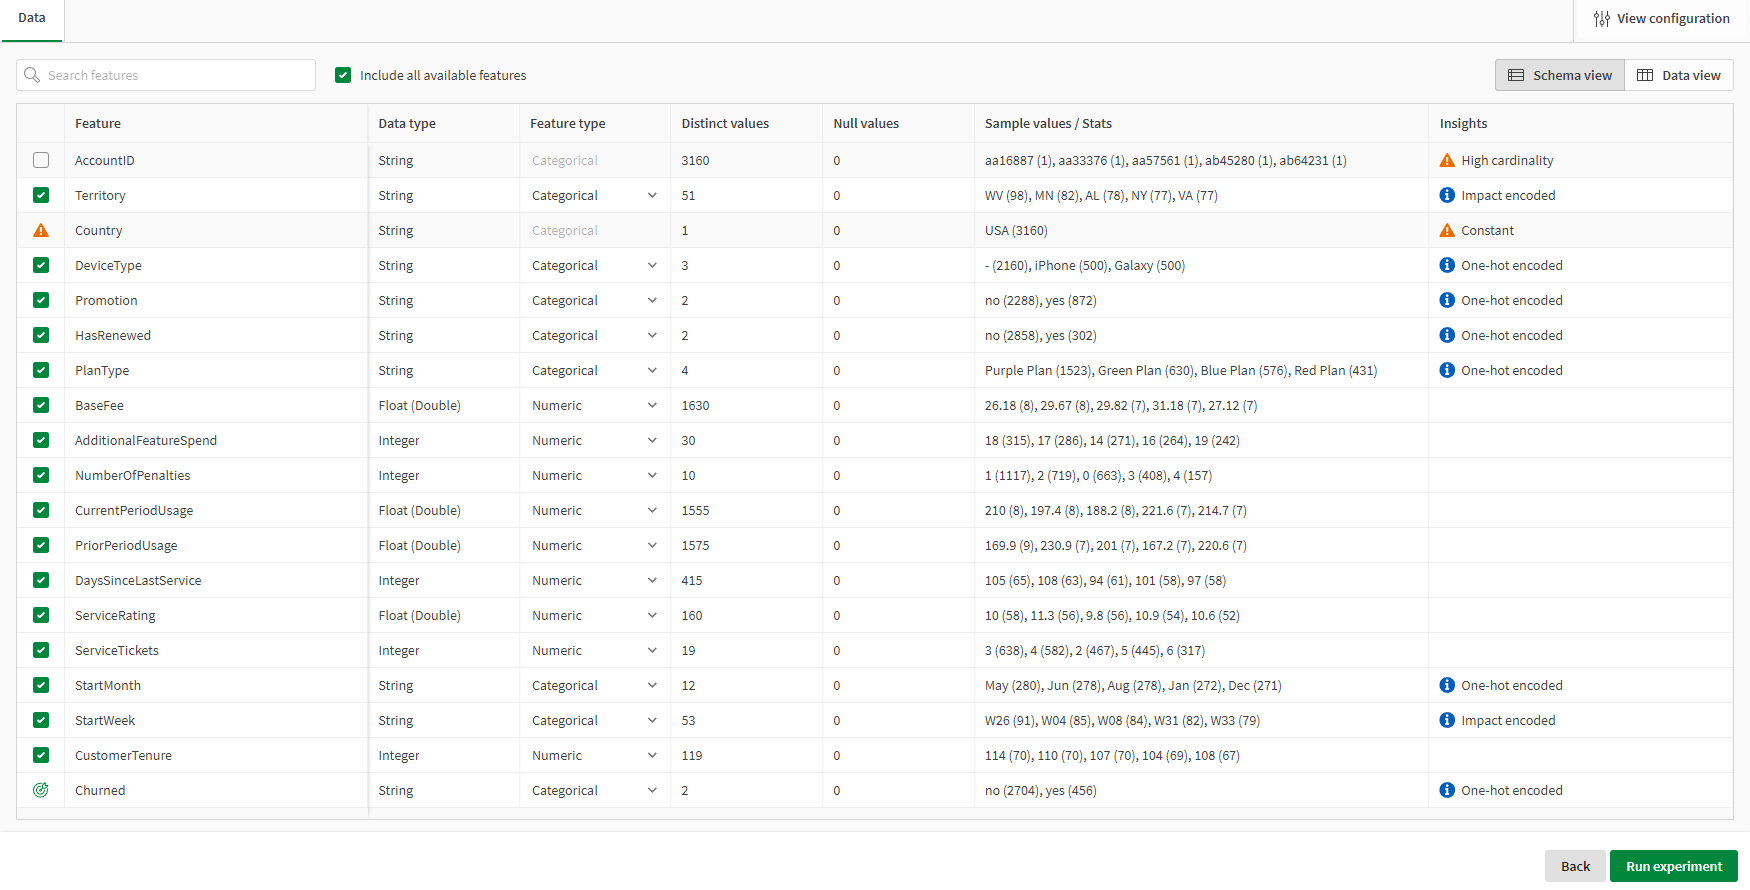
This tab allows you to manage the data in the experiment. When you first create your experiment, this is the only tab you see. As the experiment trains, you can switch to other tabs for model analysis.
In the Data tab, you can:
-
Select a target before training the first version.
-
Add or remove features.
-
View feature dataset insights and statistics.
-
Select a new training dataset.
-
Configure bias detection.
Switch between Schema view and
Data view for different representations of the training dataset.
Data tab in an ML experiment
Models
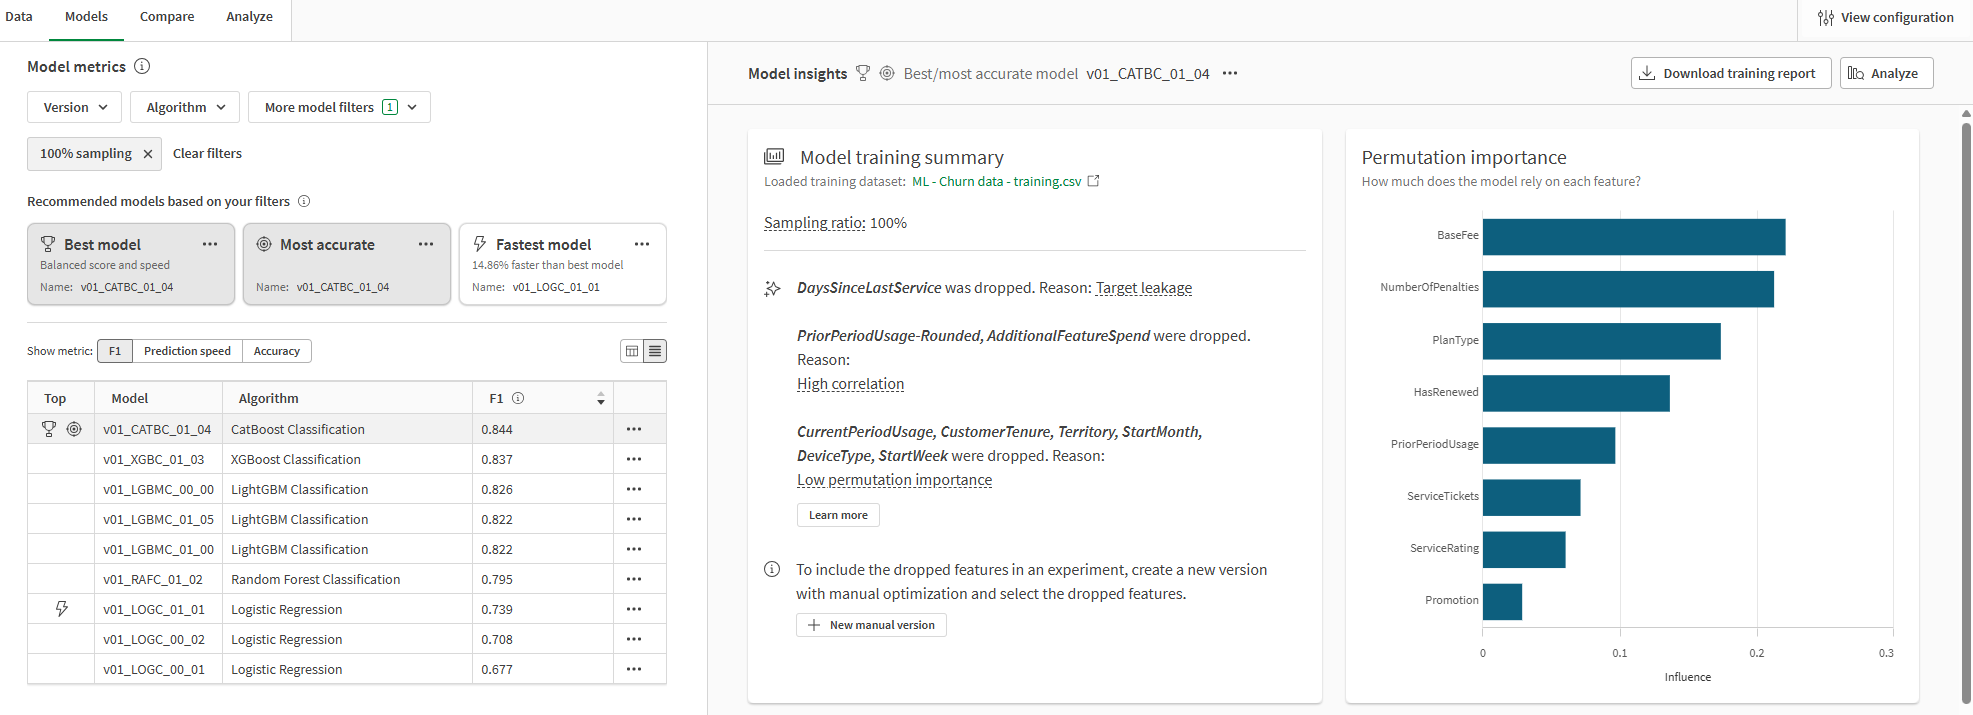
In the Models tab, perform quick analysis of the training results and explore a list of recommended models. The Models tab allows you to quickly understand and compare the core metrics for each model. A number of recommendations are provided to help you consider various predictive use cases.
To perform more detailed model analysis, you can switch to the Compare and Analyze tabs.
Select a model in the Model metrics table or from the recommendations above the table. You can view:
-
Performance scores.
-
Model training summary (available with intelligent model optimization).
-
Feature importance visualizations.
-
Other visualizations specific to the experiment type.
-
Bias detection results.
For more information, see Performing quick model analysis.
Models tab in an ML experiment trained with intelligent model optimization
Compare
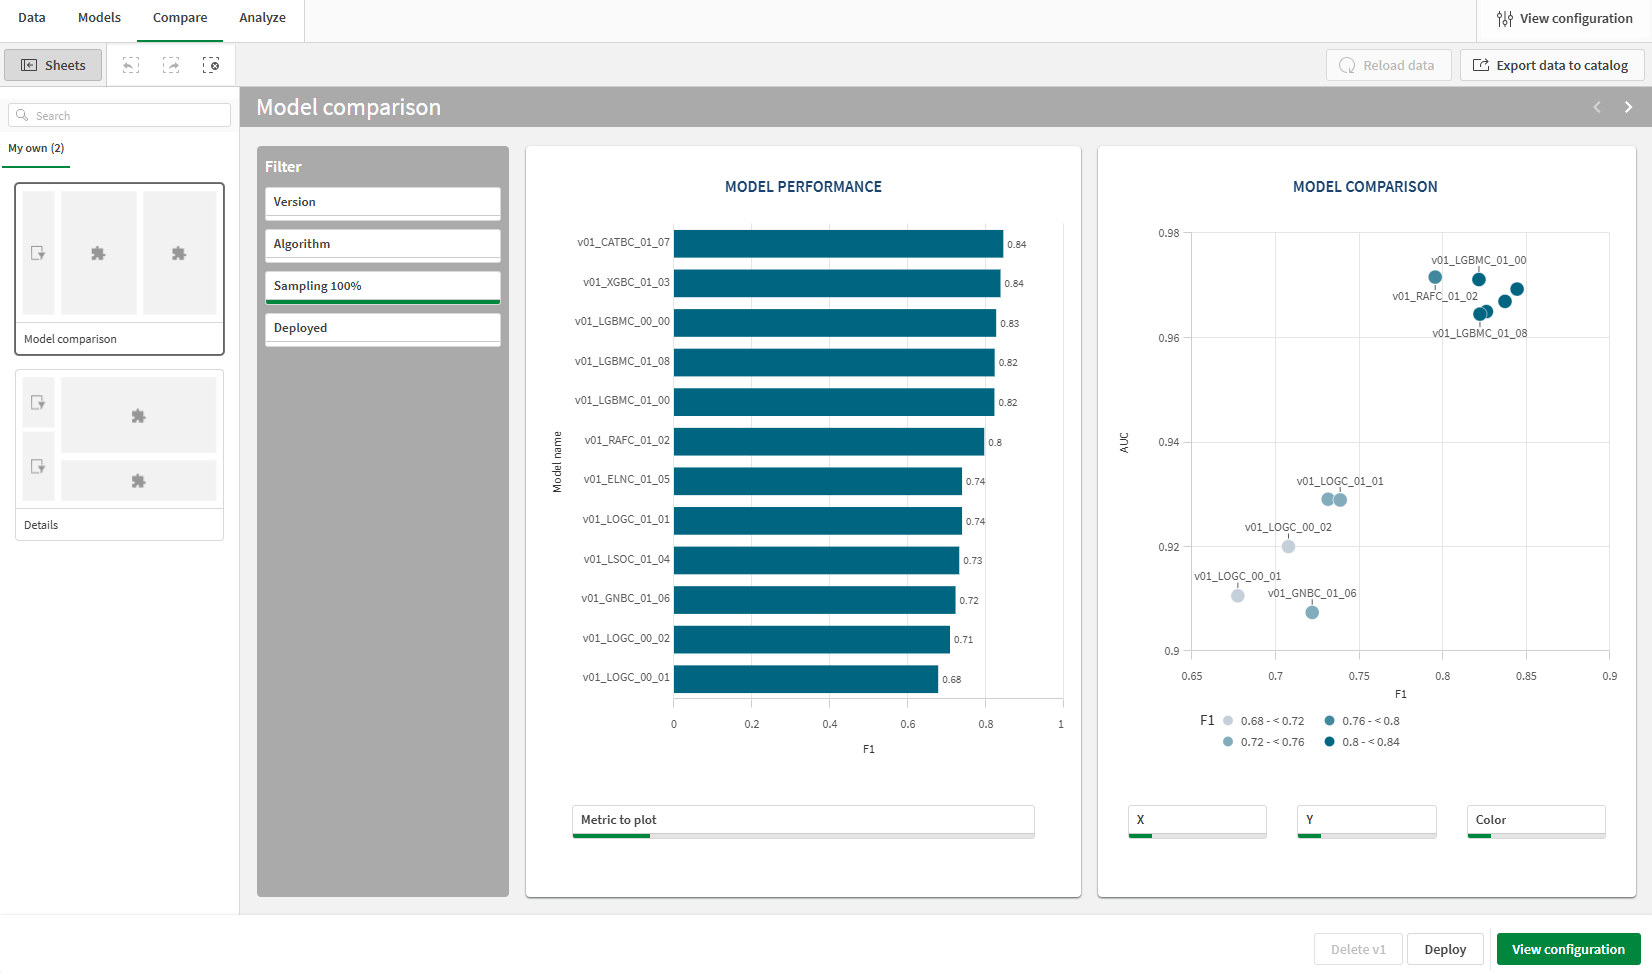
Compare your models in detail using embedded analytics. Make selections and customize the data presented in the dashboards to uncover insights about models.
In the Compare tab, you can:
-
Access all available model metrics and hyperparameters.
-
Compare training and holdout metrics across models.
For more information, see Comparing models.
Compare tab in an ML experiment
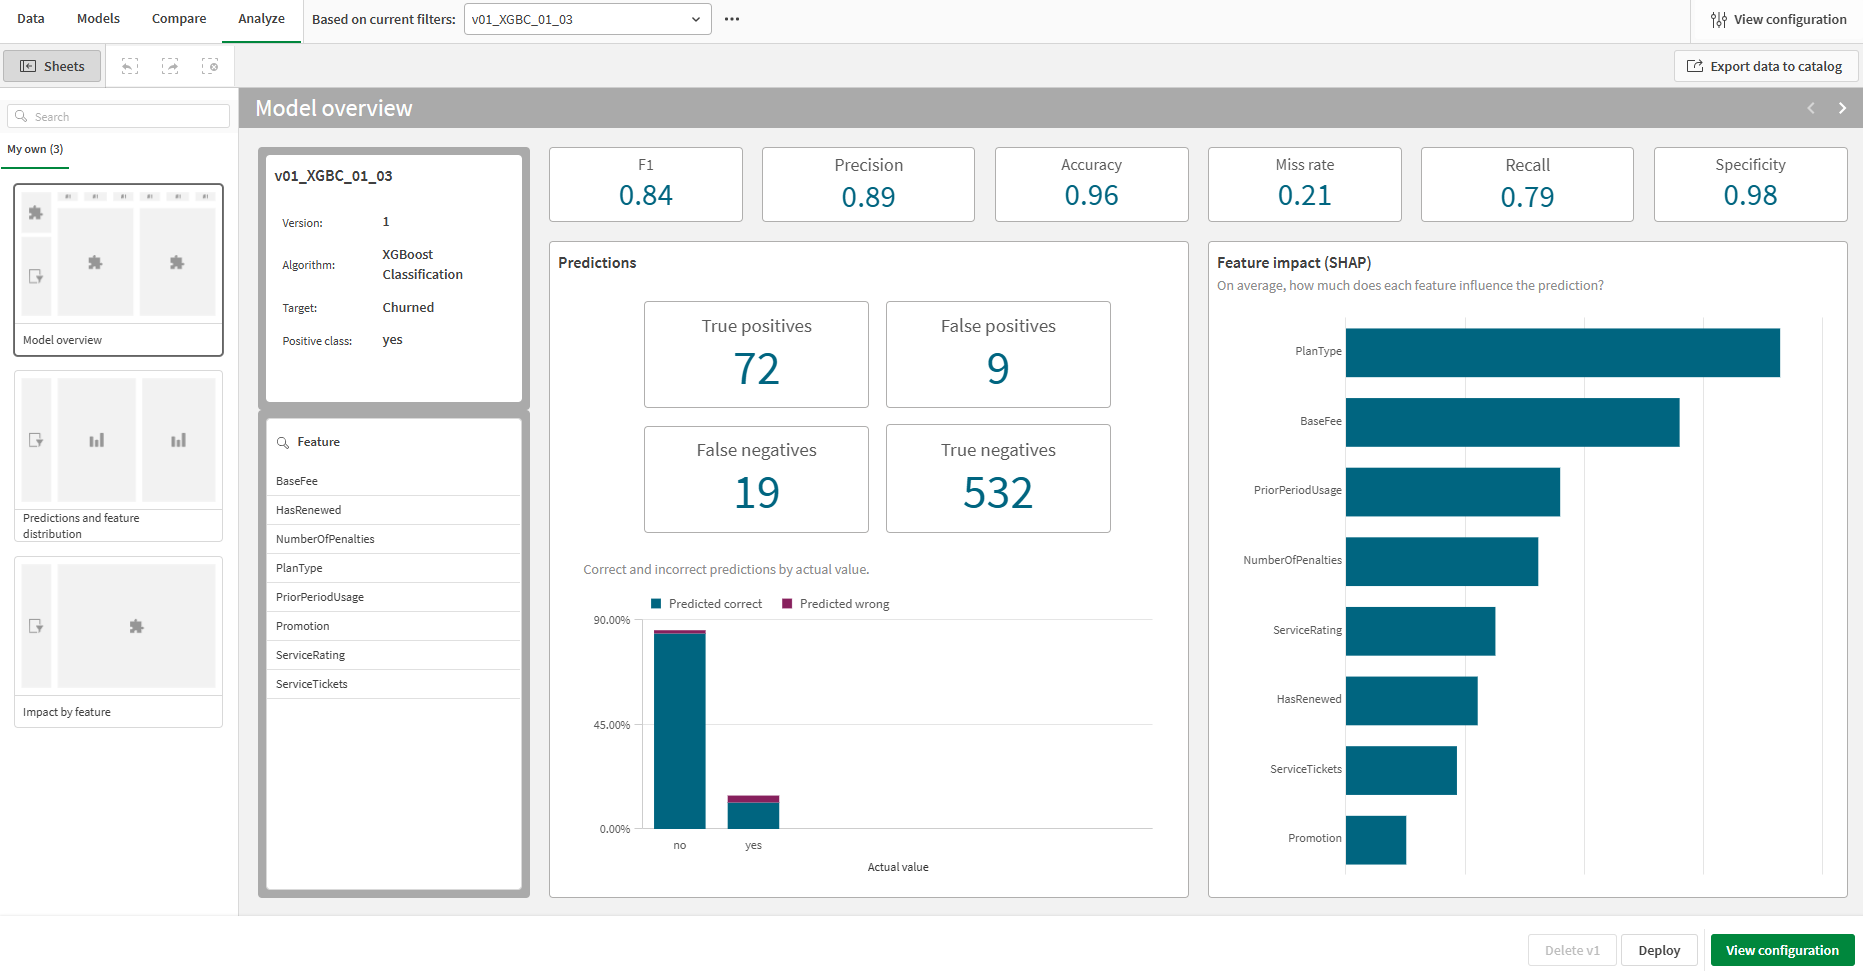
Analyze
Dive deeper with embedded analytics for each model you train.
In the Analyze tab, you can:
-
Further analyze prediction accuracy.
-
Evaluate feature importance at a granular level.
-
View the distribution of feature data.
-
View detailed information about bias detection results.
For more information about detailed model analysis, see Performing detailed model analysis.
Analyze tab in ML experiment
Experiment configuration panel
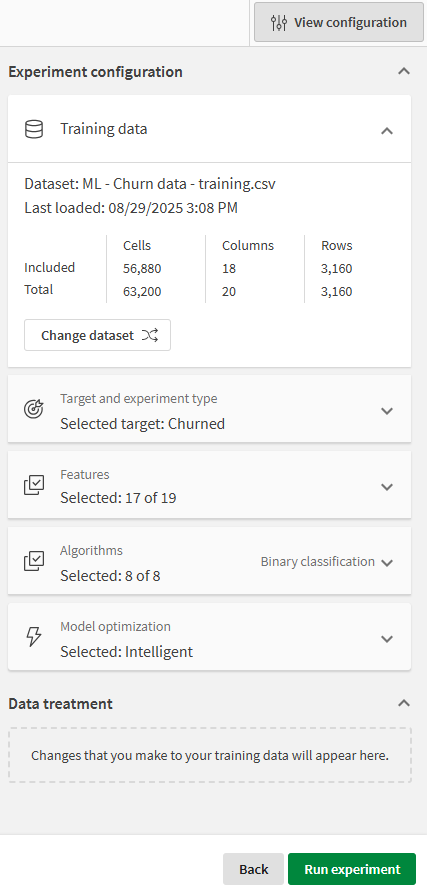
Click View configuration to expand the experiment configuration panel. With this panel expanded, you can configure the experiment settings.
With the experiment configuration panel, you can:
-
Select a target and experiment type
-
Add or remove features
-
Configure a new version of the experiment
-
Select to change or refresh the training dataset
-
Add or remove algorithms
-
Change model optimization settings
-
For time series models, set the forecast settings
-
Configure bias detection
Experiment configuration panel
