Reducing data
Qlik Sense provides several different ways to reduce the amount of data that you load into your app. You can, for example, filter data from files or from data connectors.
You can also reduce data directly in the load script.
Do the following:
- Open the Data load editor in the Scripting Tutorial app.
- Click Load data.
- In the data load editor, click the Sales tab.
- Delete the semicolon at the end of this line:
- Add the following line at the end of the load script:
- Click Load data.
- If you the add the data to a table in your app, you can see that only the data that conforms to the conditions that you created was loaded.
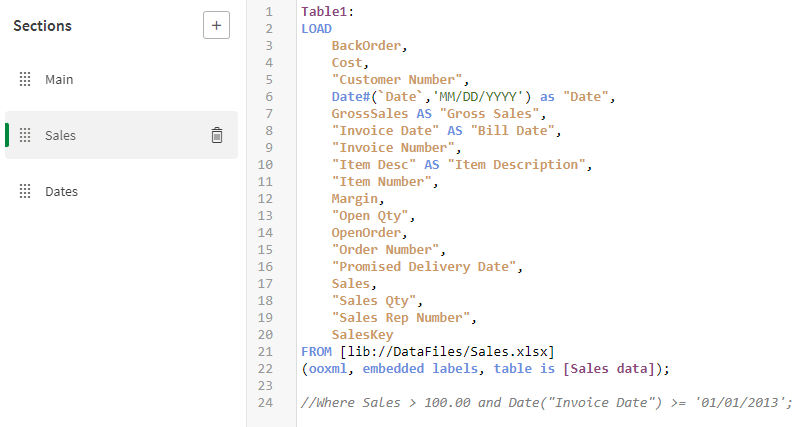
- Now that we have completed this example, comment out the Where statement. Don't forget to add a semicolon to the end of your first LOAD statement.
Based on the load script that you have written so far, Qlik Sense loads 65,534 lines from the Sales.xlsx data file into Table1. Note that Sales data is the name of the tab that contains your table in the original Sales.xlsx file.
Data load progress window

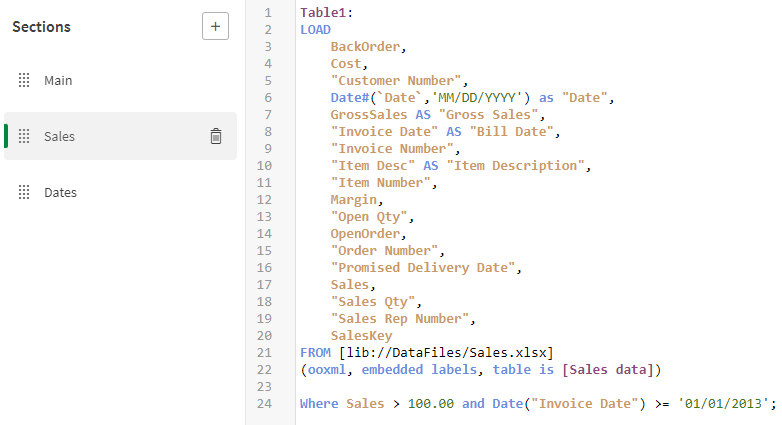
Where Sales > 100.00 and Date("Invoice Date") >= '01/01/2013';This tells Qlik Sense to only load data where sales are greater than $100.00. It also uses the Date function to load data where the date is equal to or greater than January 1, 2013.
Your script should look like this:
Load script window with script to reduce amount of data loaded

Based on your updated load script, Qlik Sense now loads fewer lines from the Sales.xlsx data file.
Data load progress window with reduced data load

Table containing Bill Date and Sales fields

Note that we added the Sales field as a dimension This is so that the Sales values are shown individually. If we had added Sales as a measure the values would have instead been aggregated per date.
Typically, you would add Sales as a measure. With measures you have the option to display values as currency amounts (for example, dollars) by applying number formatting to the column.
Number formatting applied to Sales measure

However, as we are using Sales as a dimension, we need a different approach. In this case, we will use a chart expression. Even though we are not discussing chart functions in detail in this tutorial, this is a good opportunity for a quick example.
When we use Sales as a dimension, the values are displayed as numeric, as shown in the table above.
To fix this, you can open the chart expression editor Sales field by clicking fx, and then using the Money function.
Opening the expression editor

Enter the following in the expression editor.
=Money( Sales )Expression editor

The values in the field will now display as monetary units. Those units (in this case, dollars) are specified in the Main section of the load script.
Table containing Bill Date and Sales fields. Sales now shown in dollars

Your script should look like this:
Load script window with Where statement commented out

