Reviewing and refining models
After the first version of the model training is finished, analyze the resulting model metrics and recommended models. If further modifications are required to refine the models, you can run additional versions using manual model optimization.
When you run the experiment version, you are taken to the Models tab, where you can start analyzing the resulting model metrics. You can access Schema view and Data view by returning to the Data tab. More granular analysis can be performed in the Compare and Analyze tabs.
Analyzing the Model metrics table
Switch back to the Models tab. In the Model metrics section, recommended models are highlighted based on common quality requirements. The best model has been selected automatically for analysis.
Three recommendations are provided from the models trained in the experiment. A single model can be represented in more than one recommendation. The recommendations are:
-
Best model: The model best balances top-performing accuracy metrics and prediction speed.
-
Most accurate: The model scores the highest in balanced and raw accuracy metrics.
-
Fastest model: The model has the fastest prediction speed, in addition to strong accuracy-related metrics.
It is important to choose the model that is best suited to your use case. In most cases, the Best model is the most favorable option. However, your predictive use case might require particular specifications for prediction speed or accuracy metrics.
For an in-depth overview of how the top model types are determined, see Selecting the best model for you.
Model metrics table showing recommended models and model metrics
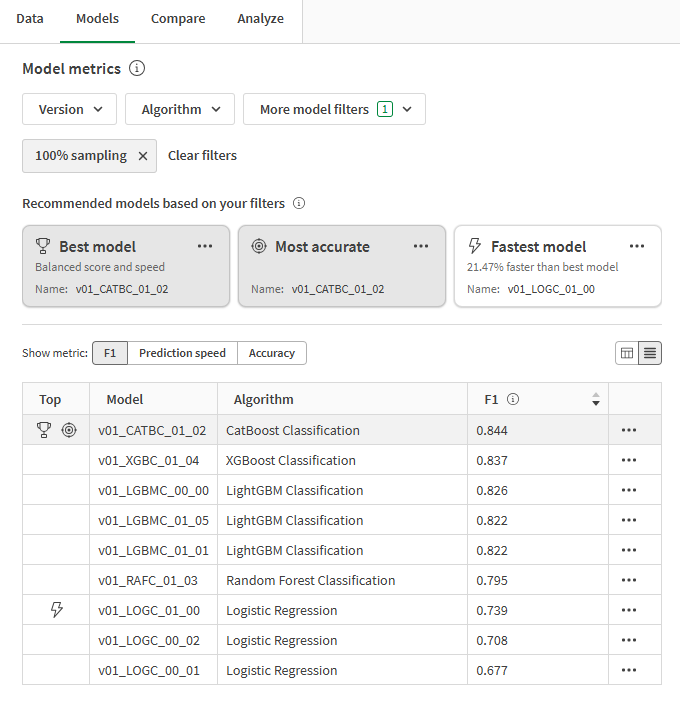
You can narrow your focus using the drop down filters above the recommendations. The top model types are automatically re-calculated each time you change the filtering.
Switch between the core metrics using the Show metric selector above the table. You can sort models based on name and the selected metric being analyzed.
Overfitted models are marked with a warning in the table. These models are not suitable for deployment. Causes of overfitting can include model complexity introduced by training algorithms, and issues with the training dataset. For more information, see Overfitting.
Analyzing the Model training summary
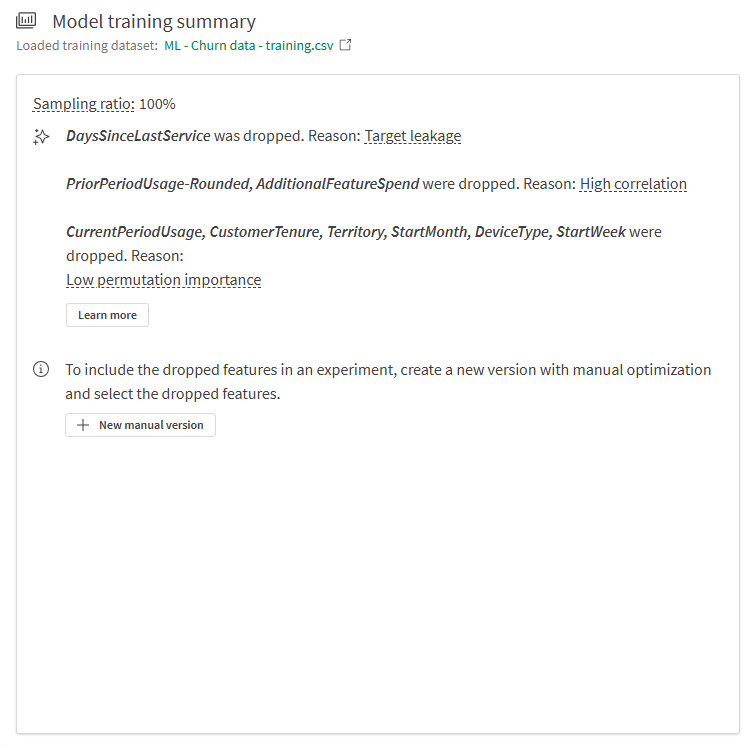
We can now focus on the Model training summary on the right side of the interface. This summary lets you explore how the model and input training data has been optimized for best performance. The model training summary is an overview of the enhancements provided by intelligent model optimization.
From the summary in the image below, we can see:
-
Features from the training data were dropped during training and not incorporated into the model.
-
The model has a sampling ratio of 100%.
Feature dropped due to target leakage
The feature DaysSinceLastService was dropped during training due to target leakage.
In this feature column, there was no logic defined during data collection to stop the counting of the number of days since a customer's last service ticket for customers that canceled their subscription. As a result, the model could have learned to associate a large number of days since last service ticket (present for customers who canceled years ago) with a value of yes in the Churned field.
This feature needed to be removed from the training because it would have resulted in model with very poor performance on new data.
The underlying issue is known as target leakage, which is a form of data leakage. For more information about data leakage, see Data leakage.
Features dropped due to high correlation
We can see that PriorPeriodUsage-Rounded and AdditionalFeatureSpend were dropped during training.
In this case, there was at least one feature column—PriorPeriodUsage-Rounded—that was directly derived from another column in the dataset. Other correlation issues were detected with AdditionalFeatureSpend.
Removing features causing correlation issues is important to train a quality model.
For more information about correlation, see Correlation.
Features dropped due to low importance
Several features were also dropped due to low permutation importance. After preliminary analysis, these features have been identified as having very low impact on the outcomes of the target. These features can be seen as statistical noise and have been removed to gain benefits to model quality.
For more information about permutation importance, see Understanding permutation importance.
Model training summary
Analyzing other visualizations in the Models tab
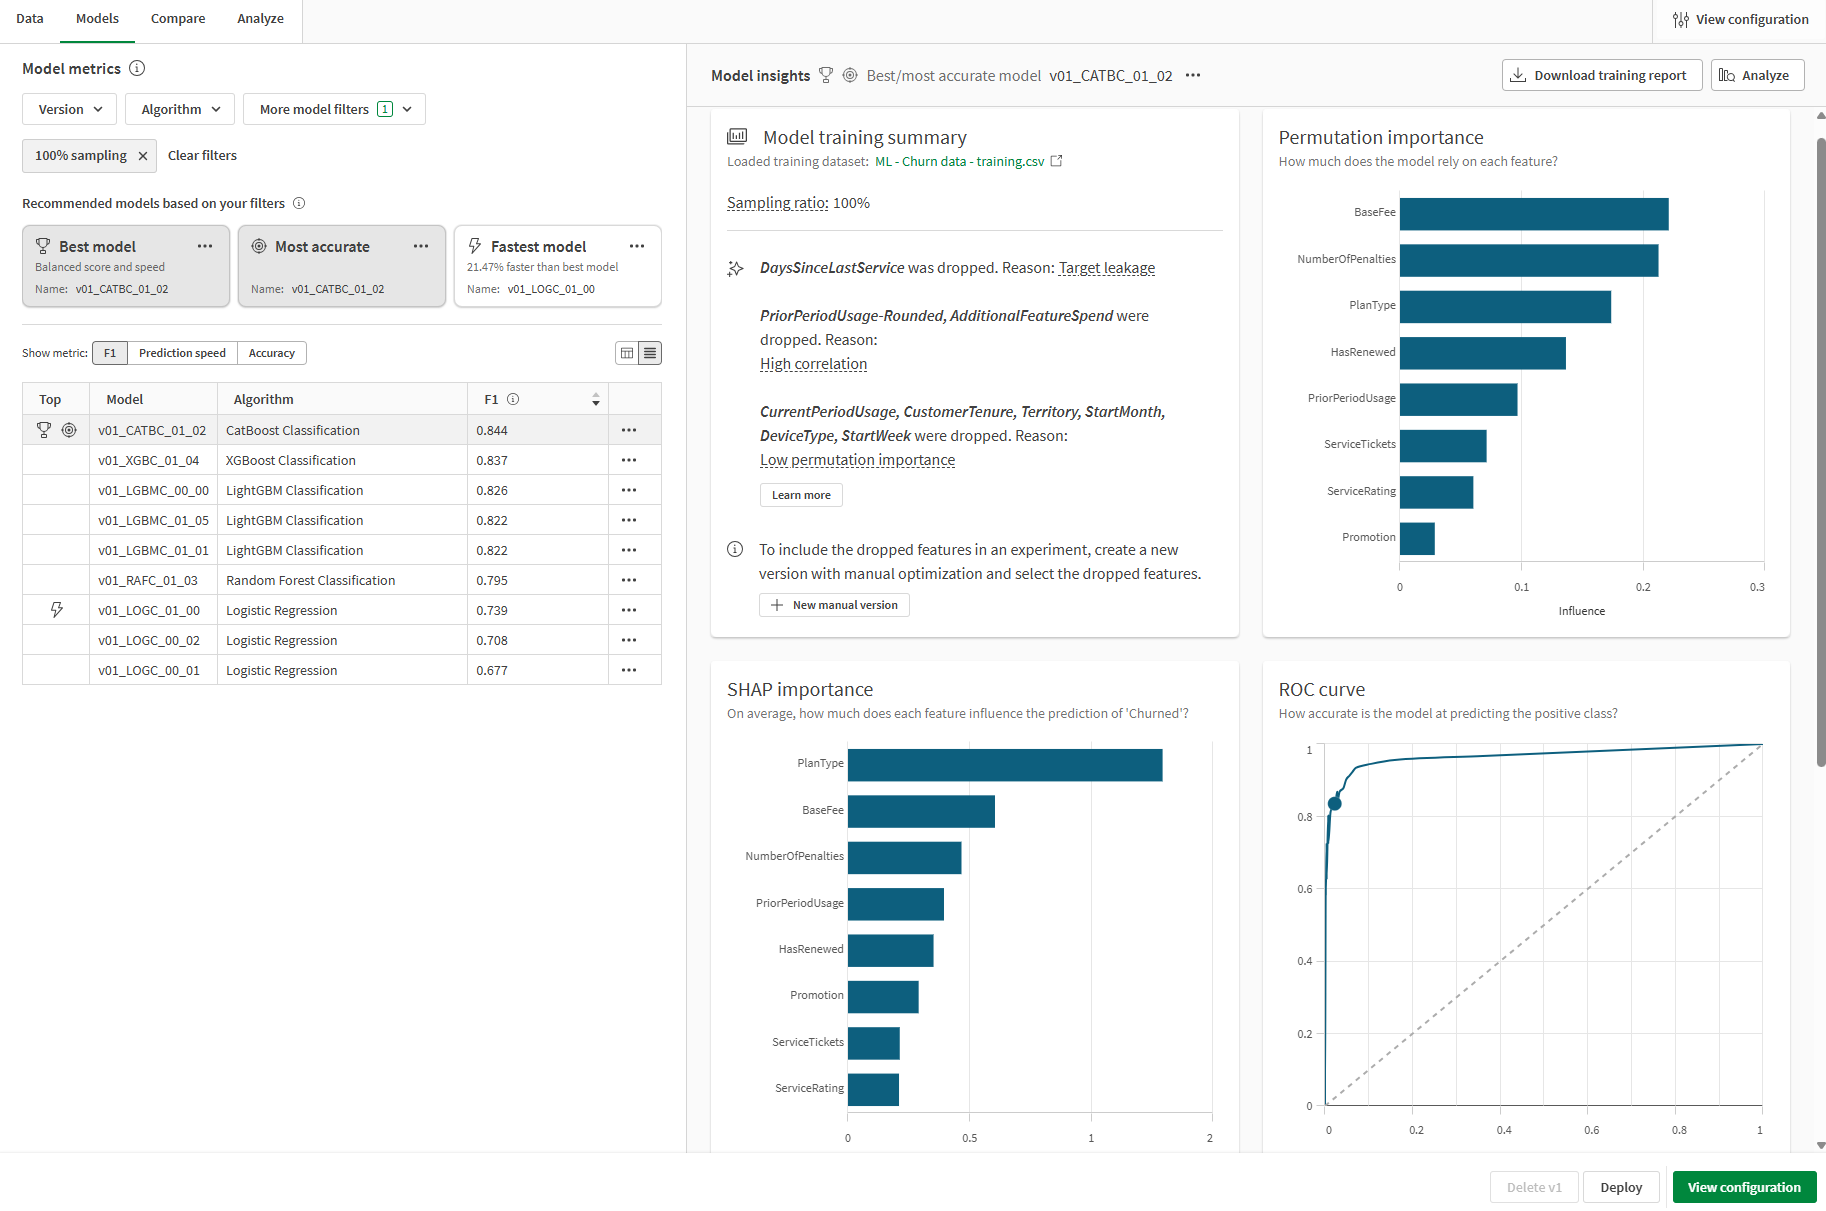
Other visualizations are available in the Models tab for additional high-level analysis. Select different models in the Model metrics table to explore feature-level performance and other charts that can offer insight into model quality.
Models tab in ML experiment showing other visualizations available for analysis
Comparing training and holdout metrics
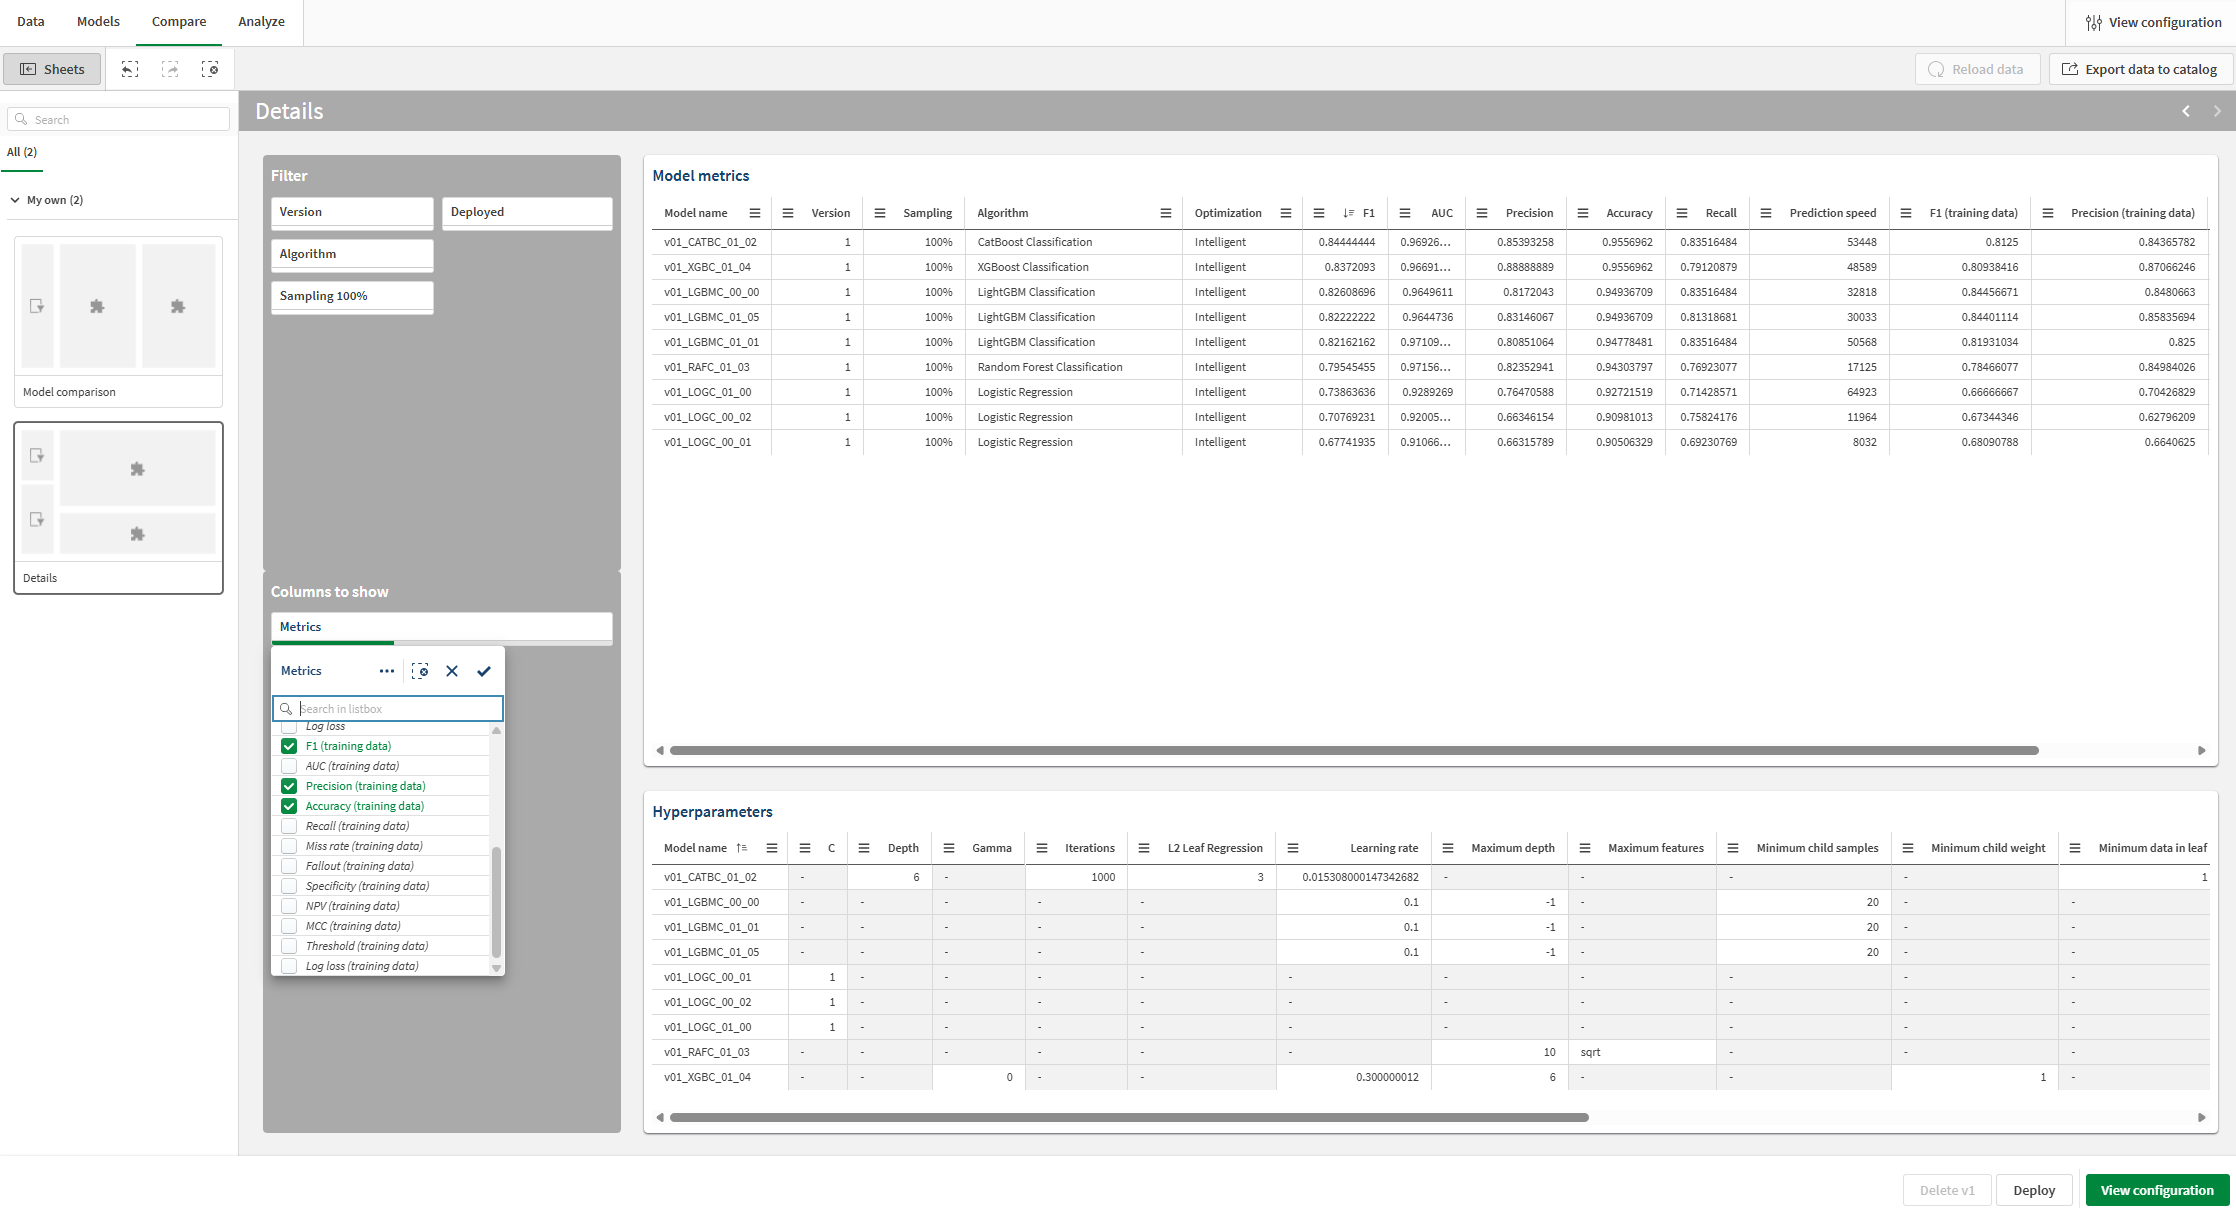
You can view additional metrics and compare the metrics from the cross-validation training to the holdout metrics.
Do the following:
-
In the experiment, switch to the Compare tab.
An embedded analysis opens. You can use the interactive interface to dive deeper into your comparative model analysis and uncover new insights.
-
In the Sheets panel on the left side of the analysis, switch to the Details sheet.
-
Look at the Model metrics visualization. It shows model scoring metrics, such as F1, as well as other information.
-
In the Columns to show section, use the filter pane to add and remove columns in the table.
-
In the drop down listbox, add additional metrics. Training scores are available to be added to the table. You can add them as needed for your analysis.
You can now see the F1 metrics from the cross-validation training and compare them to the holdout metrics.
Adding and viewing training scores for comparison with the holdout scores
Focusing on a specific model
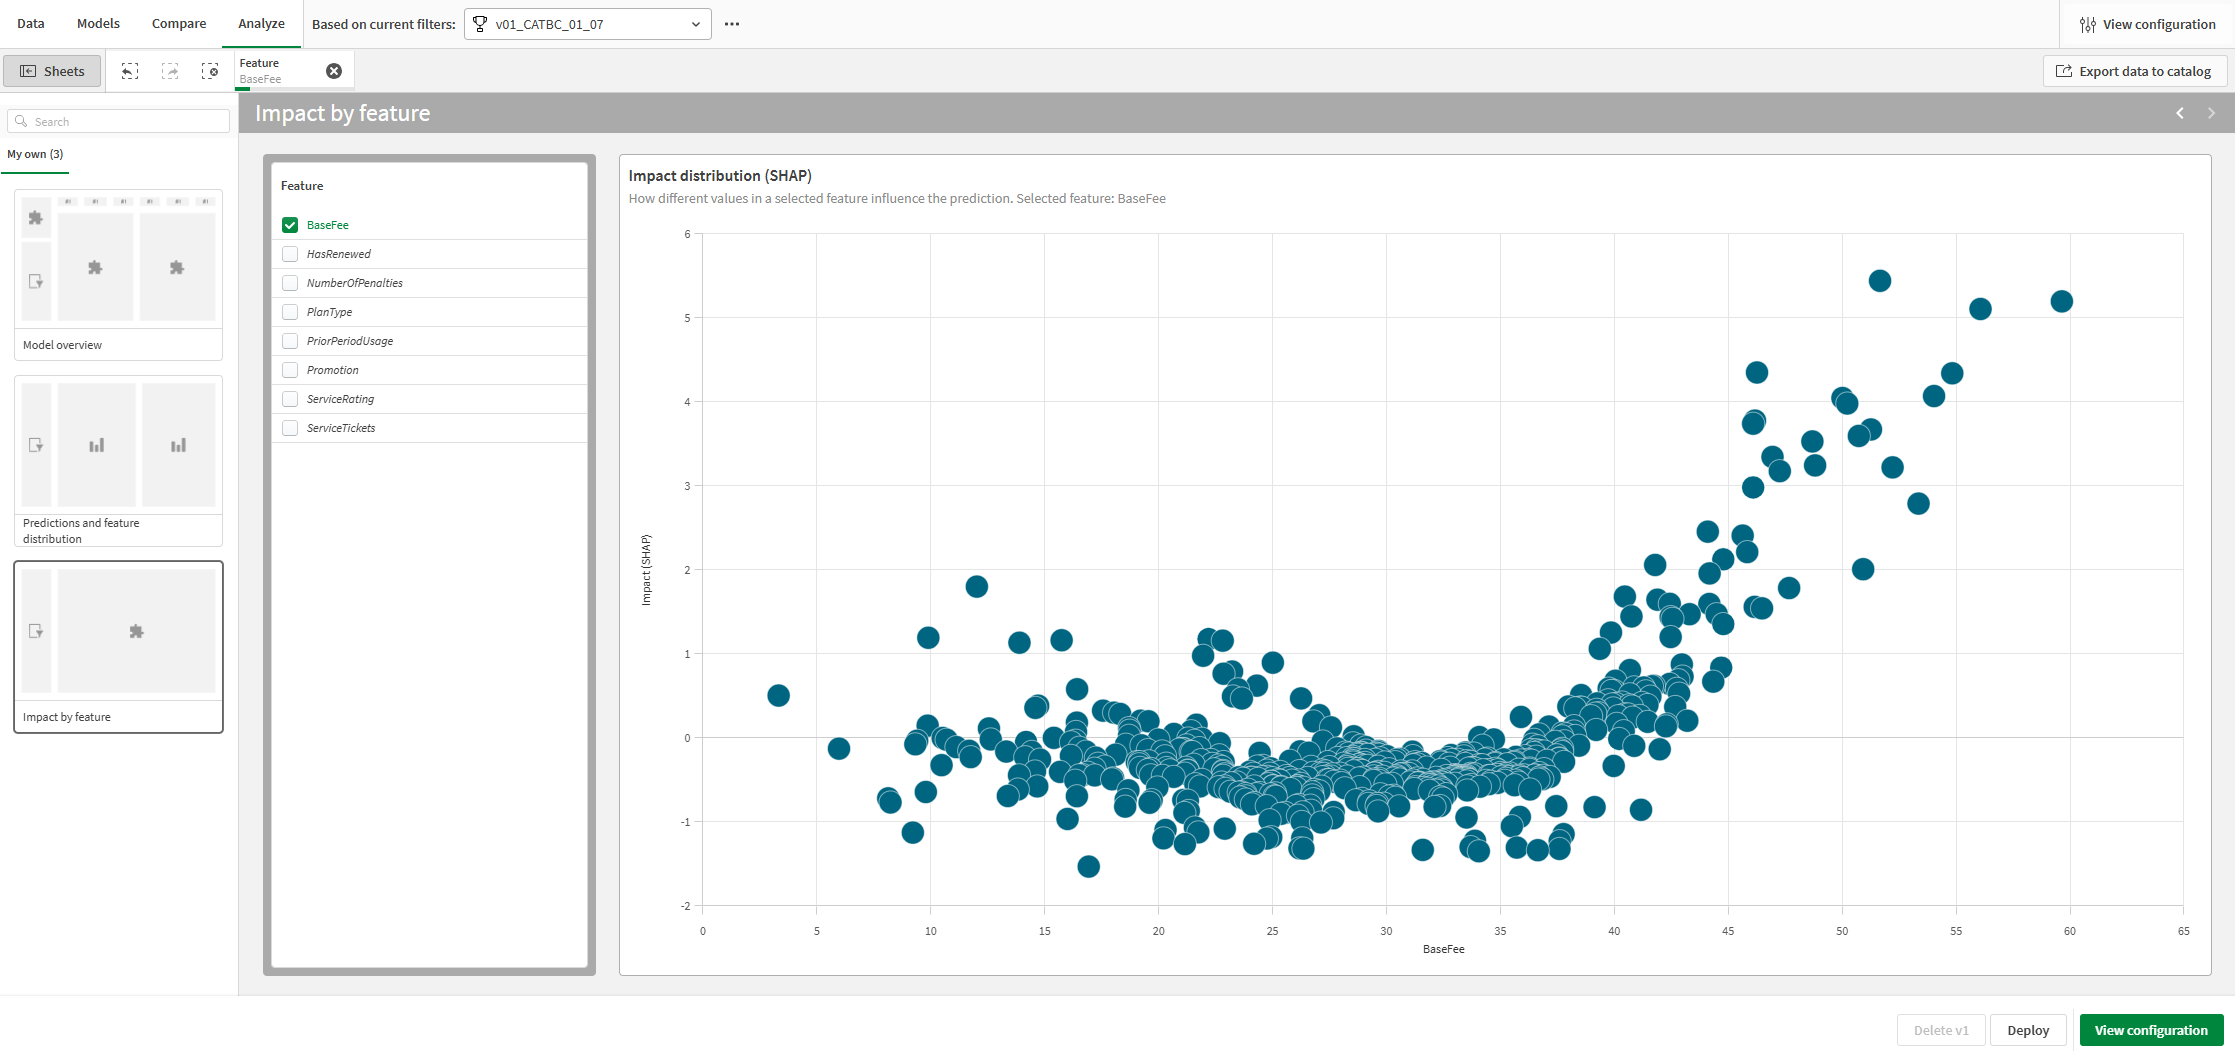
At any point during model analysis, you can perform granular analysis of an individual model. Explore prediction accuracy, feature importance, and feature distribution with an interactive experience.
Do the following:
-
Select any model, click the Analyze tab.
An embedded analysis opens.
-
With the Model overview sheet, you can analyze the prediction accuracy of the model. Analysis is enhanced by the power of selections. Click a feature or predicted value to make a selection. The data in the embedded analysis adjusts to filter the data. You can drill down in specific feature values and ranges to view how the feature influence and prediction accuracy change.
-
Switching to the other sheets, you can view visualizations for prediction accuracy, feature distribution, and impact distribution (SHAP). This analytics content can help you to:
-
Uncover the key drivers influencing trends in the data.
-
Identify how specific features and cohorts are affecting predicted values and prediction accuracy.
-
Identify outliers in the data.
-
Analyze tab in an ML experiment
Next steps
After running a version of the experiment with intelligent model optimization, you can run manual versions as needed to refine your models. To quickly create a new manual version, you could switch back to the Models tab and click New manual version in the Model training summary.
In a real-world scenario, it is important to repeat any refining steps as many times as needed before deploying your model, to ensure that you have the best possible model for your particular use case.
For more information about refining models, see Refining models.
In this tutorial, move to the next section about deploying your model.
