Measures are calculations used in visualizations, typically represented on the y-axis of a bar chart or a column in a table. Measures are created from an expression composed of aggregation functions, such as Sum or Max, combined with one or several fields.
A measure must have a name, and may also be supplied with descriptive data such as description and tags.
Example:
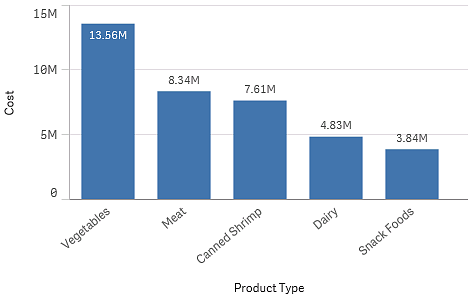
You can, for example, create a bar chart to visualize the cost of each type, by adding the Product Type dimension to the chart, and the measure Cost, which is made from the expression Sum(Cost), that is the result of the calculation of the aggregation function Sum over the field Cost. The results are grouped by the Product Type dimension.
Bar chart with the dimension Product Type and the measure Cost.

Creating measures
When you load data into an app, all data is loaded as fields. When you add a measure to a chart or create a master measure, these fields can be used in aggregations to perform specific calculations.
The process of creating a measure depends on whether you want to customize or standardize a particular calculation. Follow these guidelines:
-
To simply add a calculation to a chart, enter the measure expression when configuring the chart. No additional configuration is needed.
-
Create a master measure in the app if you want to:
-
Create a standalone entity in the app that is easily recognized as a useful calculation.
-
Enhance and expand the definitions of a calculation. For example, you can define colors and label expressions so they are added whenever the measure is used, rather than configuring these properties separately in each instance.
-
Allow a centralized definition of a measure, so a change in the central definition will propagate through the app to all objects where the measure is referenced.
-
Allow re-use of the measure across the app, including by others.
After creating the master measure, it can be added to any applicable charts as you configure them.
-
Learn more
- Fields
- Data grouping with dimensions
- Using expressions in visualizations
- Reusing assets with master items
- Creating a master measure from the data model viewer
- What is a measure?
- Understanding dimensions and measures
