
Creating and managing data pipeline projects
You can create a data pipeline to perform all your data integration within a project using data tasks. Onboarding moves data into the project from data sources that are on-premises or in the cloud and stores the data in ready-to-consume data sets. You can onboard data to a data warehouse or to Qlik Open Lakehouse.
When you onboard data to a data warehouse, you can also perform transformations and create data marts to leverage your generated and transformed data sets. The data pipeline can be simple and linear, or it can be a complex pipeline consuming several data sources and generating many outputs.
All data tasks will be created in the same space as the project that they belong to.
You can also view lineage to track data and data transformations backwards to the original source, and perform impact analysis which shows the forward-looking, downstream view of data task, dataset, or field dependencies. For more information, see Working with lineage and impact analysis in Data Integration.
Onboarding data to a data warehouse
This includes landing the data to a staging area, and then storing the datasets in a cloud data warehouse. Landing and Storage data tasks are created in a single step. If you need to, you can also perform landing and storage with separate tasks.
Onboarding data to Qlik Open Lakehouse
Create a Qlik Open Lakehouse pipeline project to copy data from any supported source to Iceberg open table format. Tables can be accessed and queried from your cloud data warehouse analytics engine, without duplicating data by using a Mirror data task.
Registering data that is already on the data platform
Register data that already exists on the data platform to curate and transform data, and create data marts. This lets you use data that is onboarded with other tools than Qlik Talend Data Integration, for example, Qlik Replicate, or Stitch.
Transforming data
Create reusable row-level transformations on the onboarded data based on rules and custom SQL. This creates a Transform data task.
Creating and managing data marts
Create a data mart to leverage your data sets. This creates a Data mart data task.
Creating knowledge marts
Create a knowledge mart to embed and store your structured and unstructured data in a vector database. This creates a Knowledge mart data task.
Target data platforms
The project is associated with a data platform that is used as target for all output.
For more information about supported data platforms, see Setting up connections to targets.
Video introduction to projects
Example of creating a project
The following example performs onboarding data, transforming the data and creating a data mart. This will create a simple linear data pipeline that you could expand by onboarding more data sources, create more transformations, and add the generated data tasks to the data mart.
Example of a linear data pipeline in a project

-
Create a new project.
In Data Integration > Pipeline projects, click Create new > Project.
-
Enter a name and a description for the project.
Information noteIf you later enable version control for the project, you will not be able to change the project name while it is under version control. -
Select a space to create the project in. All data tasks will be created in the space of the project that they belong to.
- Select Data pipeline in Use case.
-
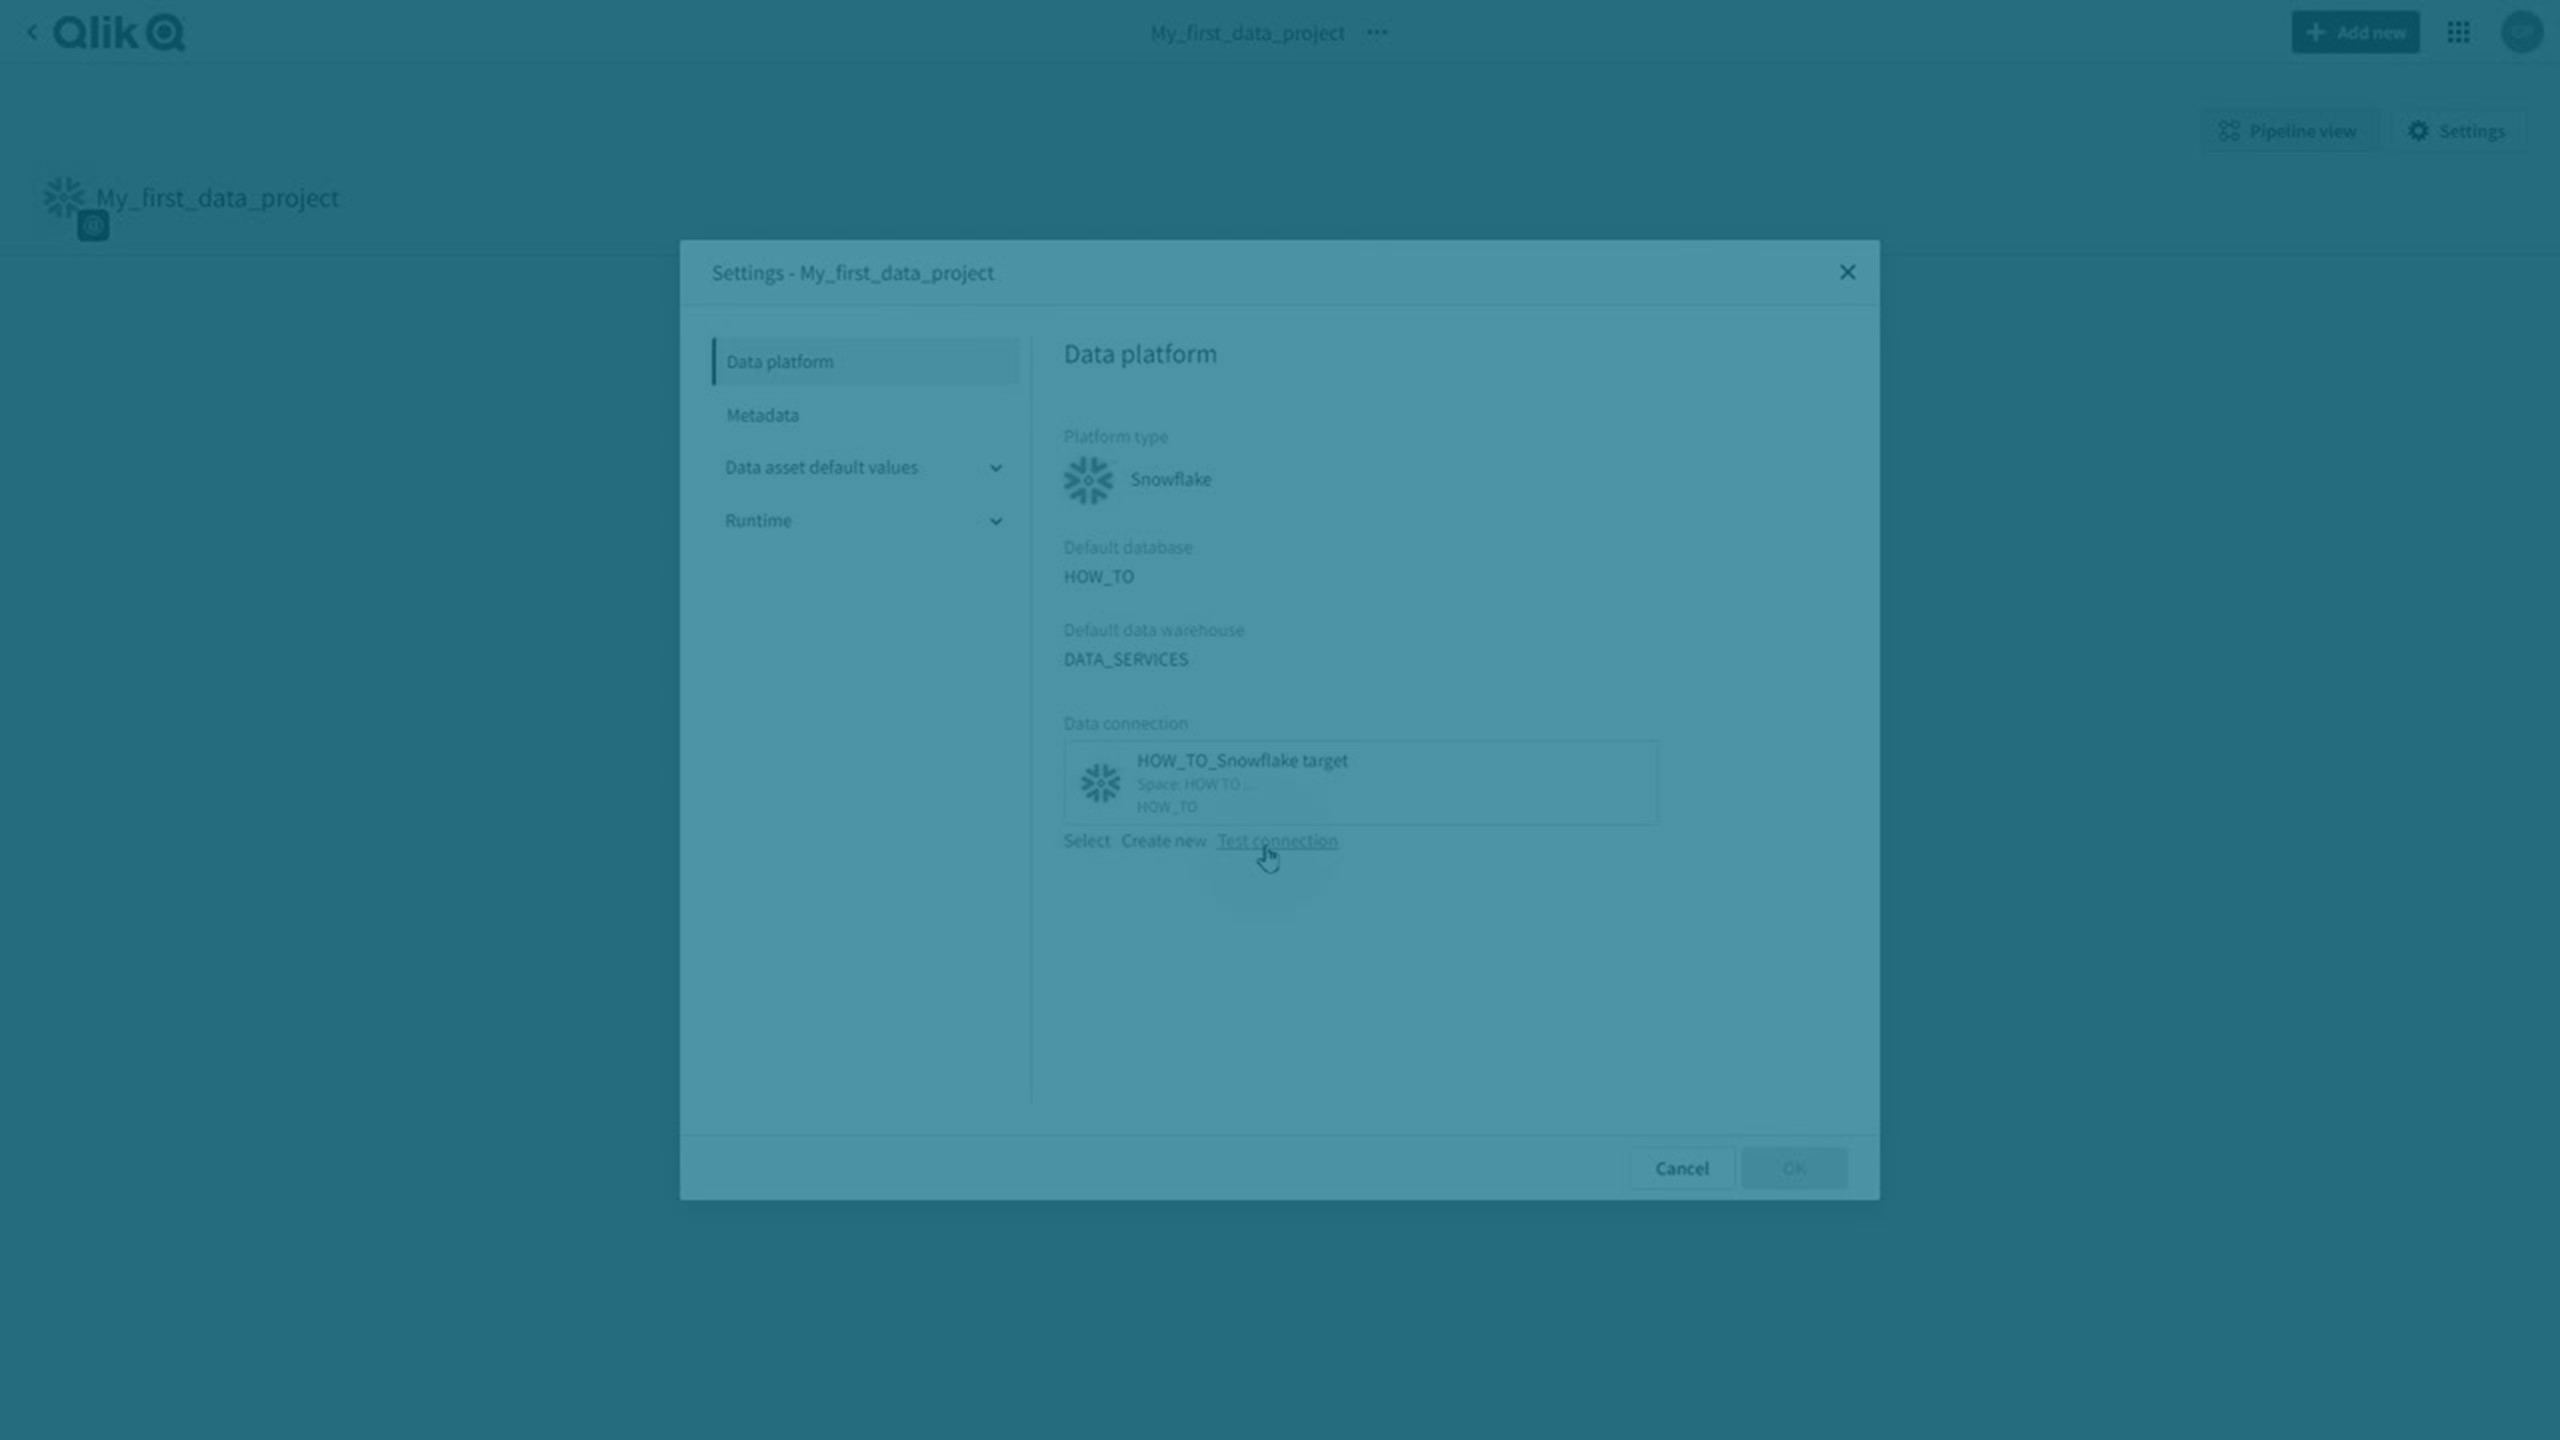
Select which data platform to use in the project.
-
Select a connection to the cloud data warehouse that you want to use in the project. This will be used to land data files and store datasets and views. If you have not prepared a connection already, create one with Create new.
-
If you selected Google BigQuery, Databricks, or Microsoft Azure Synapse Analytics as data platform, you also need to connect to a staging area.
-
If you selected Snowflake as data platform, you can select to land data to cloud storage. See Landing data to a lakehouse.
-
If you selected Qlik Cloud as data platform:
You can either store data in Qlik managed storage, or your own managed Amazon S3 bucket. If you want to use your own Amazon S3 bucket, you need to select a connection to that bucket.
In both cases, you also need to select a connection to an Amazon S3 staging area. If you use the same bucket that you defined in the previous step, make sure that you use another folder in the bucket for staging.
-
-
Click Create.
The project is created, and you can create your data pipeline by adding data tasks.
-
-
Onboard the data
In the project, click Create and then Onboard data.
For more information, see Onboarding data to a data warehouse.
This will create a landing data task and a storage data task. To start replicating data you need to:
-
Prepare and run the landing data task.
For more information, see Landing data from data sources.
-
Prepare and run the storage data task.
For more information, see Storing datasets.
-
-
Transforming the data
When the storage data task is created, go back to the project. You can now perform transformations on the created datasets.
Click ... on the storage data task and select Transform data to create a transformation data task based on this storage data task. For instructions about transformations, see Transforming data.
-
Creating a data mart
You can create a data mart based on a storage data task or a transformation data task.
Click ... on the data task and select Create data mart to create a data mart data task. For instructions about creating a data mart, see:
When you have performed the first full load of the stored and transformed datasets and data marts, you can use them in an analytic application, for example. For more information about creating analytics applications, see Creating an analytics application using datasets generated in Data Integration.
You could also expand the data pipeline by onboarding more data sources, and combine them in the transformation, or in the data mart.
Building cross-project pipelines
You can build cross-project pipelines where a task can consume tasks from another project. This lets you achieve segmentation in several possible ways:
-
You can create a separate data movement pipeline for each organizational unit and consume the outputs in a single data mart pipeline.
-
You can create a single data movement pipeline and consume the output in several transformation pipelines.
Transform and Data mart tasks can consume Storage and Transform tasks located in another project.
-
You must have at least Can consume role in the space of the consumed project.
-
Both projects must be on the same data platform.
All datasets of a task are shared with downstream projects. This means that if you want to achieve dataset segregation, you must filter datasets out in the consumed project by creating a transform task.
In the projects view, you can view tasks that are consumed by another project, and tasks from other projects that are consumed in the current project. All tasks outside the current project are gray. The dependencies are by reference and not name, which means you can rename a task without breaking the reference. This also means that if you delete a task that is consumed and create a new task with the same name, the reference will still be broken.
There are several ways to reuse existing data:
-
Creating a new project
Select the option Use data from another project after creating a project.
You can create a transformation or a data mart, consuming onboarded data from another pipeline.
-
In a Transform task or Data mart task, you can select data from another project in Select source data.
When selecting source data, select Project. If the selected project is under version control, select a Branch. The default branch is main. The data task list updates to reflect the selected branch. Then select a Data task to see which datasets are available.
You can choose if you want to display tasks in other projects that consume a task in this project.
-
Click Layers and turn Cross-project output on or off.
All tasks outside the current project are gray.
Version control limitations
As cross-project pipelines are split between several projects, this adds complexity when using version control. In these examples Project1 is consumed by Project2.
Example of a cross-project pipeline

-
Project2 can consume a specific branch of Project1. Select the branch in Select source data in the transform or data mart task. The default branch is main. If the referenced project is not under version control, the branch selector is not shown and Project2 uses the project as-is.
-
You can create a branch for Project1, but the branched version will not show that it is consumed by Project2.
-
You can merge Project2 to main, but the dependency will still exist.
If the branch selected in Project1 is later deleted, the reference breaks in the same way as when a referenced task is deleted. If the referenced task has different output on the selected branch, the reference behaves in the same way as when the referenced task output changes.
Best practices
-
Check that the tasks in the consumed project are at least prepared, to make sure that they are valid.
-
If you are planning to export and import projects between tenants, it will be easier if you keep the same names for spaces and projects in the tenants. If the names differ you will need to map projects and tasks when importing the project.
-
If you want to change the data platform using export and import, all projects with dependencies must be on the same platform.
Follow these steps for a safe and easy platform change. In this example the project that is consumed is called Consumed, and the project reading from Consumed is called Consumer.
-
Export Consumed and Consumer.
-
Import Consumed to Consumed_New, changing to the new data platform.
-
Import Consumer to Consumer_New, changing to the same data platform as Consumed_New, and replacing the source project (Consumed) with Consumed_New.
-
Operations in a data pipeline project
You can perform the same operations that are available for a data task as project operations. This allows you to orchestrate the operations in the data pipeline.
-
Turn schedules on and off
-
Perform design operations
-
Start and stop execution of data tasks
-
Delete data tasks
Click Operations to view the status of an operation in progress, or the latest performed operation.
You can stop an operation in progress by clicking Stop operation. Data tasks that are in progress will not be stopped, but it will cancel any task that has not started yet.
Turning schedules on and off
You can control the schedules for data tasks on project level.
-
Click ..., and then Schedule.
You can turn the schedule on or off for all data tasks, or a selection of tasks. Only tasks with a schedule defined are displayed.
Information noteThis option is not available for projects with Qlik Cloud as data platform.
For more information about scheduling individual data tasks, see:
Performing design operations
You can perform design operations on all data tasks in the project, or on a selection of tasks. This makes it easier to control the dataset tasks in the project, instead of performing the design operations individually in each task.
-
Validate
Click Validate to validate all tasks, or a selection of tasks. Data tasks that were changed since the last validate operation are preselected.
The data tasks are validated in pipeline order.
-
Prepare
Click Prepare to prepare all tasks, or a selection of tasks. Data tasks that were changed since the last prepare operation are preselected.
You can select to recreate datasets that require a structure change not supported by the data platform. This can lead to data loss.
-
Recreate
Click ..., and then Recreate tables to recreate the datasets from source for all tasks, or for a selection of tasks.
Information noteIf there are problems with individual tables, it is recommended to first try reloading the tables instead of recreating them. Recreating tables may cause a loss of historical data. If there are breaking changes, you must also prepare downstream data tasks that consume the recreated data tasks to reload the data.
Running data tasks
You can initiate the execution of all data tasks in the project, or on a selection of tasks, instead of running tasks individually. For example, you can run all tasks with a time-based schedule. This will initiate downstream tasks with an event-based schedule.
-
Run
Click Run to initiate the execution of all tasks, or a selection of tasks. This initiates the run of all selected tasks, and completes as soon as they start executing.
You can select from all tasks that are ready to run. Tasks with a time based schedule and tasks that use CDC are preselected. Tasks with an event-based schedule are not preselected as they will be executed when they have data to process.
In a project with Qlik Cloud as data platform, all landing and storage tasks are preselected.
Information noteAll data tasks are executed in parallel. This means that dependency checks may prevent some tasks from running. -
Stop
Click Stop to stop all tasks, or a selection of tasks.
You can select from tasks that are running.
Deleting data tasks
-
Click Delete to delete all data tasks in the project, or a selection of tasks.
It is not possible to delete tasks that are running, or tasks that are used by other tasks.
Changing the view of a project
There are two different views of project. You can switch between the views by clicking Pipeline view.
-
The pipeline view shows the data flow of the data tasks.
You can choose how much information to show for the data tasks by clicking Layers. Toggle on or off the following information:
-
Status
-
Data freshness
-
Schedule
-
Cross-project output
This will display tasks in other projects that consume a task in this project. All tasks outside the current project are gray.
-
-
The card view shows a card view with information about the data task.
You can filter on asset type and owner.
Deleting a project
-
In Pipeline projects view, click
 on a project and select Delete.
Select Keep tables and views created by the tasks in this project to retain tables and views that would normally be dropped after a project is deleted. Note that for the following task types, tables and views will always be kept, even when this option is not selected:
-
Landing tasks
-
Lake landing tasks
-
Replication tasks
Viewing data
You can view a sample of the data to see and validate the shape of your data as you are designing your data pipeline.
The following permissions are required:
-
Viewing data is enabled on tenant level in Administration.
Enable Settings > Feature control > Viewing data in Data Integration.
-
You are assigned the Can view data role in the space where the connection resides.
-
You are assigned the Can view role in the space where the project resides.
To view sample data in the data pipeline view:
-
Click
 in the preview banner at the bottom of the pipeline view.
 -
Select which data task to preview data for.
A sample of the data is displayed. You can set how many data rows to include in the sample with Number of rows.
Exporting and importing projects
You can export a project to a JSON file that contains everything required to reconstruct the project. The exported JSON file can be imported on the same tenant, or on another tenant. You can use this, for example, to move projects from one tenant to another, or to make backup copies of projects.
For more information, see Exporting and importing data pipelines.
Changing owner of a project
Data tasks operate in the context of the owner of the project they belong to. You can change the owner of a project to transfer control of all tasks in the data project to another user. This is for example useful if there are projects that are owned by a user that was deleted.
-
In the project view, click ... and then Change owner.
The ownership change will apply to all tasks in the project. All cataloged datasets that are created by tasks in the project will also change owner.
Changing data platform connection
If you change the Data platform connection for a project, you must:
-
Recreate tables in all landing tasks.
-
Prepare all other tasks in the project.
Viewing project information
Click ![]() on the menu bar to view project information, such as:
on the menu bar to view project information, such as:
-
Owner
-
Space
-
Data platform
-
Project ID
Project settings
You can set properties that are common to the project and all included data tasks.
-
Click Settings.
For more information, see Data pipeline project settings.