
Slider
The slider object allows you to connect a variable or field for dynamic, interactive switching of values during analysis. You can adjust the variable or field by dragging the slider.
Slider configurations
The Slider can be configured in several ways depending on your use case.
Field slider
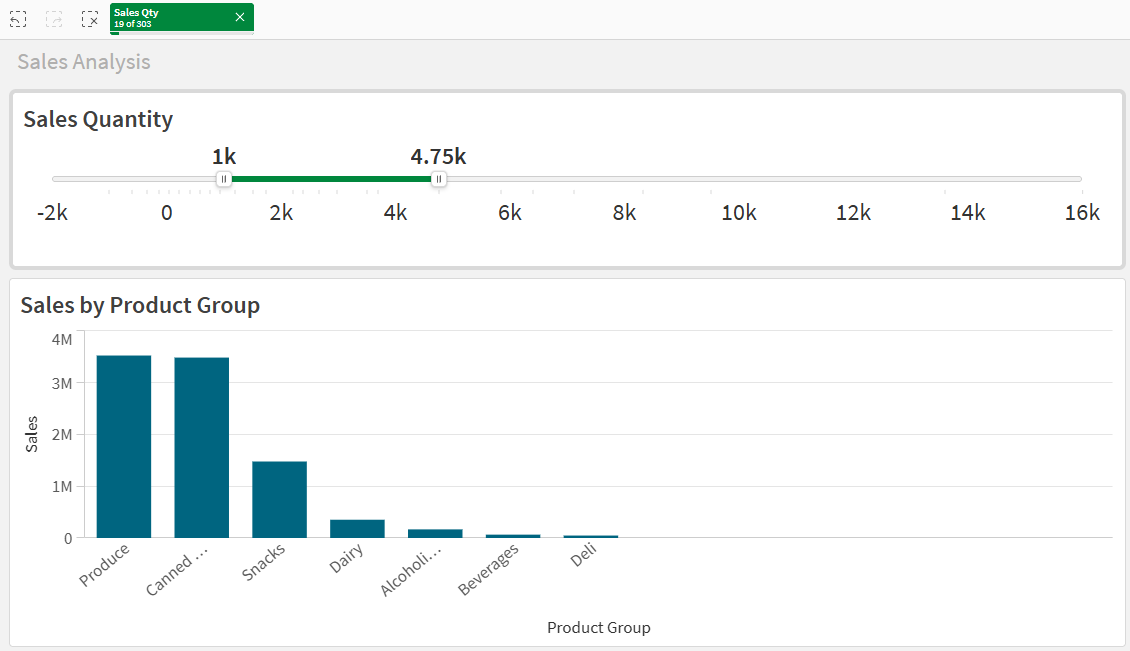
A field slider allows selections in a field from the application. The slider can be configured to select text, numeric, and date values. When configured as a multi-value slider, ranges of values can be selected.
Using a slider to select values from a field.
Variable slider
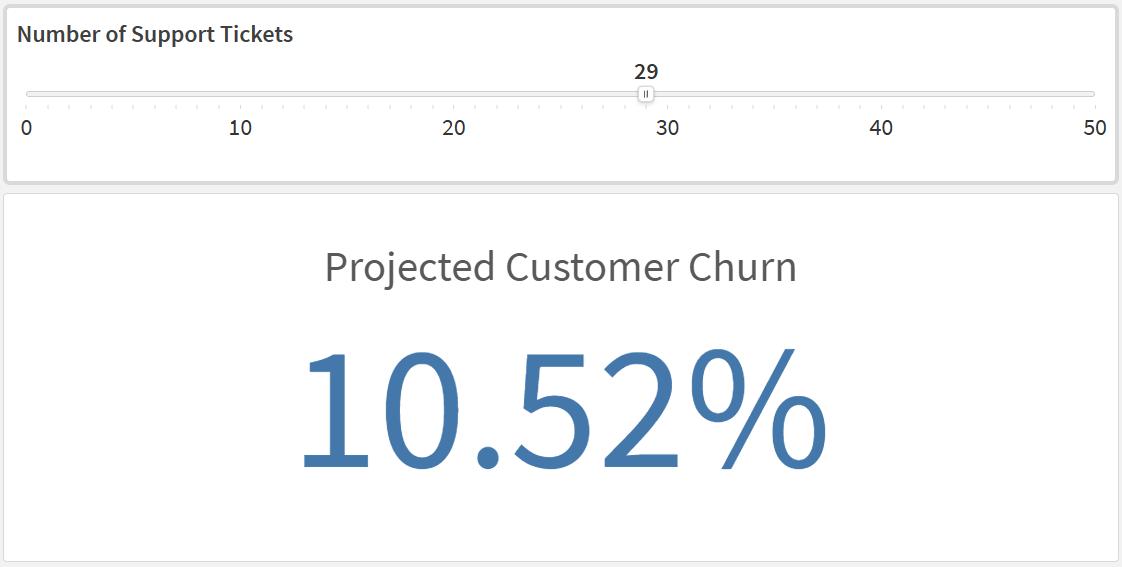
A variable slider lets users change the values of one or two numeric variables on the fly. You can configure the analysis to change based on user input—for example, you can configure different charts to appear for different values, or you can create what-if simulations.
Slider connected to a variable, allowing what-if analysis.
When to use sliders
You should use a slider when:
-
You want to make it easy for users to filter data based on numeric values or dates.
-
You need to allow users to modify variable values for dynamic or what-if analysis.
Use cases and examples
Use a slider when users need a fast way to test values during analysis.
Filter by a numeric range
Connect a field slider to an amount field, such as sales or margin. Users can drag the handles to focus on a specific value range and immediately update all charts on the sheet.
Filter by date period
Connect a field slider to a date field to narrow analysis to a specific period. This is useful for reviewing trends in a selected month or quarter without opening multiple filter panes.
Run what-if simulations
Connect a variable slider to a variable used in expressions, such as discount rate or growth factor. Users can test different assumptions and compare the impact on KPIs and charts in real time.
Limitations
-
In Direct Query applications, field sliders are not available.