Monitoring deployed model operations
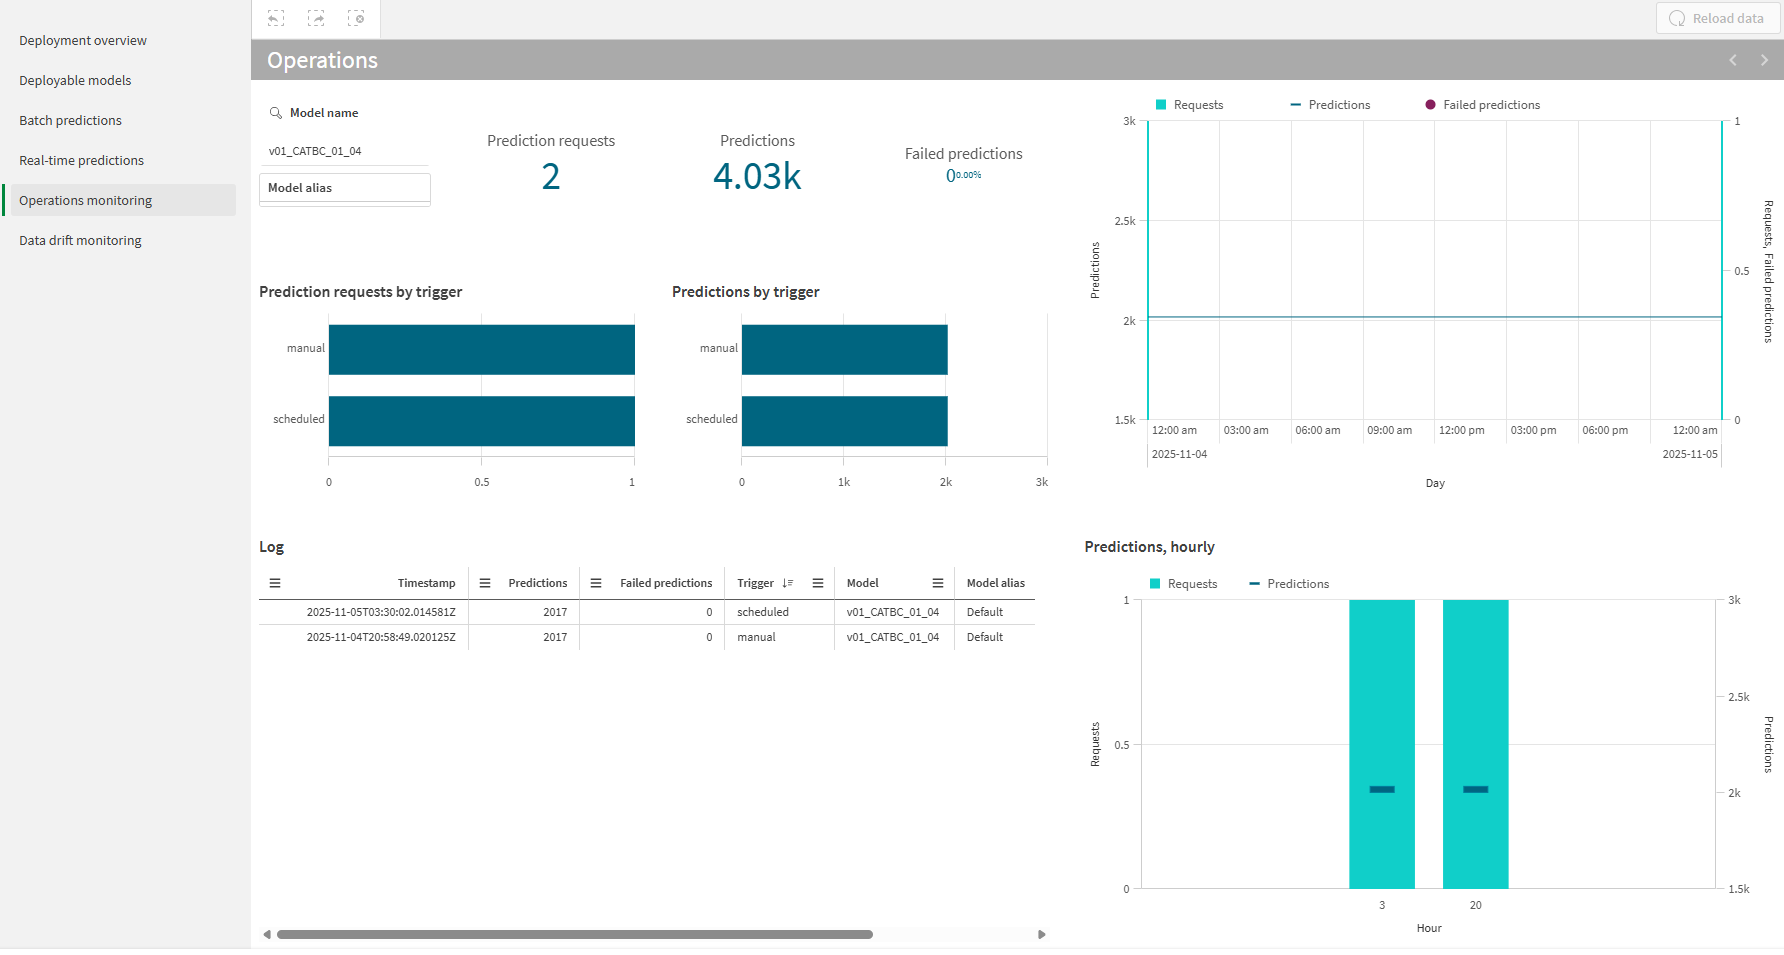
You can view details about the usage of your ML deployment for predictions, such as how many rows have been predicted or how each prediction was triggered. To access these details, open the Operations monitoring tab in your ML deployment.
Model operations analysis in Qlik Predict

View a detailed log showing each prediction event, along with key details such as who when it happened, who initiated it, whether it finished successfully or not, and how it was triggered.
Navigating embedded analytics
Use the interactive interface to analyze the deployed model with embedded analytics.
Making selections
Use selections to refine the data. You can select features and their specific values or ranges, and filter for specific dates and importance ranges. In some cases, you might need to make one or more selections for visualizations to be displayed. Click data values in visualizations to make selections.
You can work with selections by:
-
Select values by clicking content, defining ranges, and drawing.
-
Search within charts to select values.
-
Click a selected field in the toolbar at the top of the embedded analysis. This allows you to search in existing selections, lock or unlock them, and further modify them.
-
In the toolbar at the top of the embedded analysis, click
to remove a selection. Clear all selections by clicking the
icon.
-
Step forward and backward in your selections by clicking
and
.
Customizing tables
The table visualizations allow you to customize their look and feel, as well as the columns displayed in them. Tables can be customized with the following options:
-
Adjust column width by clicking and dragging the outside border of the column
-
Click a column header to:
-
Adjust the column's sorting
-
Search for values in the column
-
Apply selections
-
Launching a model operations analysis
Do the following:
-
Open an ML deployment.
-
From the left panel, select Operations monitoring.
Availability of the analysis
Depending on how long you have had your model operations analysis open, you might need to create a new session if the current session expires. The timeout is 15 minutes.
To refresh the analysis, reload your browser window.
Reloading data
Click Reload data to refresh the analysis with the latest prediction event data. If you or other users run additional predictions after you open the analysis, you may need to reload the data to visualize the new events.
Available analysis options
In your model operations analysis, you can access the following details about the deployment:
-
The number of prediction requests.
-
The number of individual predictions generated. For each row in a dataset to predict, one prediction is generated. For real-time predictions, each individual prediction is tracked.
-
Breakdowns of the number of prediction requests and predictions by trigger.
-
A detailed timeline for all prediction events, showing the number of prediction events, as well as the number of successful and failed predictions.
-
A breakdown of the hour at which each prediction request and prediction completion occurred.
-
A detailed log showing each prediction event, along with key details such as when it happened, who initiated it, whether it finished successfully or not, and how it was triggered.
