Comparing models
In the Compare tab of the experiment, you can view all model scores and hyperparameters for the models you train. Compare models using embedded analytics.
After training finishes, perform comparative analysis of models in the Compare tab. When you have finished comparing your models, you can switch to the Analyze tab for detailed analysis of individual models. For more information, see Performing detailed model analysis.
Analysis workflow
For a complete understanding of the model training results, it is recommended that you complete quick analysis, then proceed with the additional options in the Compare and Analyze tabs. Quick analysis provides a Model training summary showing which features have been dropped during the intelligent optimization process, and also provides a number of auto-generated visualizations for quick consumption. The Compare and Analyze tabs do not show the Model training summary, but let you drill down deeper into the model metrics to better understand the quality of your models. For more information about quick analysis, see Performing quick model analysis.
Understanding the concepts
It can be helpful to have a basic understanding of the concepts behind model analysis before you start comparing your models. For more information, see Understanding model review concepts.
Impact of optimization settings on analysis
For classification and regression experiments, your analysis experience can be slightly different depending on whether or not you have used intelligent model optimization. Intelligent model optimization is turned on by default for new classification and regression experiments.
Analyzing models trained with intelligent optimization
By default, new classification and regression experiments run with intelligent model optimization.
Intelligent model optimization provides a more robust training process that ideally creates a model that is ready to deploy with little to no further refinement. The performance of these models when deployed for production use cases is still dependent on training them with a high-quality dataset that includes relevant features and data.
If your version was trained with intelligent model optimization, consider the following:
-
Each model in the version can have different feature selection depending on how the algorithm analyzed the data.
-
From the Models tab, read the Model training summary for the model before diving into specific analysis. The Model training summary shows a summary of how Qlik Predict automatically optimized the model through iterating on feature selection and applying advanced transformations.
For more information about intelligent model optimization, see Intelligent model optimization.
Analyzing models trained without intelligent optimization
Alternatively, you might have turned off intelligent model optimization for the version of the training. Manual optimization of models can be helpful if you need more control over the training process.
If you used manual optimization, all models in the version will have the same feature selection, so a Model training summary is not needed.
Inspecting the configuration
During preprocessing, features might have been excluded from being used in the training. This typically happens because more information is known about the data as training progresses than before you run the version.
After reviewing the Model training summary (only shown with intelligent optimization), you can take a closer look at the experiment configuration if you need to check for these other changes.
Do the following:
-
In the experiment, switch to the Data tab.
-
Ensure you are in
Schema view.
-
Use the drop down menu in the toolbar to select a model from the version.
-
Analyze the model schema. You might want to focus on the Insights and Feature type columns to see if certain features are dropped or have been transformed to a different feature type.
For example, it is possible that a feature initially marked as Possible free text has been excluded after you ran the version.
For more information about what each of the insights means, see Interpreting dataset insights.
Note that if you ran the version with the default intelligent optimization option, each model in the version could have different feature selection due to automatic refinement. If the version was run without intelligent optimization, the feature selection will be the same for all models in the version. For more information about intelligent model optimization, see Intelligent model optimization.
Based on what you find in this configuration, you might need to return to the dataset preparation stage to improve your feature data.
Launching a model comparison
Do the following:
-
Open the Compare tab after training has finished.
The analytics content depends on the model type, as defined by the experiment target. Different metrics will be available for different model types.
Navigating embedded analytics
Use the interface to interactively compare models with embedded analytics.
Switching between sheets
The Sheets panel lets you switch between the sheets in the analysis. Each sheet has a specific focus. The panel can be expanded and collapsed as needed.
Making selections
Use selections to refine the data. You can select models, features, and other parameters. This allows you to take a closer look at the training details. In some cases, you might need to make one or more selections for visualizations to be displayed. Click data values in visualizations and filter panes to make selections.
You can do the following with regard to selections:
-
Select values by clicking content, defining ranges, and drawing.
-
Search within charts to select values.
-
Click a selected field in the toolbar at the top of the embedded analysis. This allows you to search in existing selections, lock or unlock them, and further modify them.
-
In the toolbar at the top of the embedded analysis, click
to remove a selection. Clear all selections by clicking the
icon.
-
Step forward and backward in your selections by clicking
and
.
The analyses contain filter panes to make it easier to refine the data. In a filter pane, click the check box for a value to make a selection. If the filter pane contains multiple listboxes, click a listbox to expand it then make any desired selections.
Customizing tables
The table visualizations allow you to customize their look and feel, as well as the columns displayed in them. Tables can be customized with the following options:
-
Adjust column width by clicking and dragging the outside border of the column
-
Click a column header to:
-
Adjust the column's sorting
-
Search for values in the column
-
Apply selections
-
Reloading data
Click Reload data to refresh the analysis with the latest training data. If you or other users run additional versions of the training after you open the analysis, you will need to reload the data to visualize these newer versions.
Exporting data to catalog
You can export the data used in the model comparison analysis to the catalog. Data is exported to a space in Qlik Cloud Analytics. You can use the exported data to create your own Qlik Sense apps for custom analysis.
For more information, see Exporting model training data.
Ranking models by specific metrics
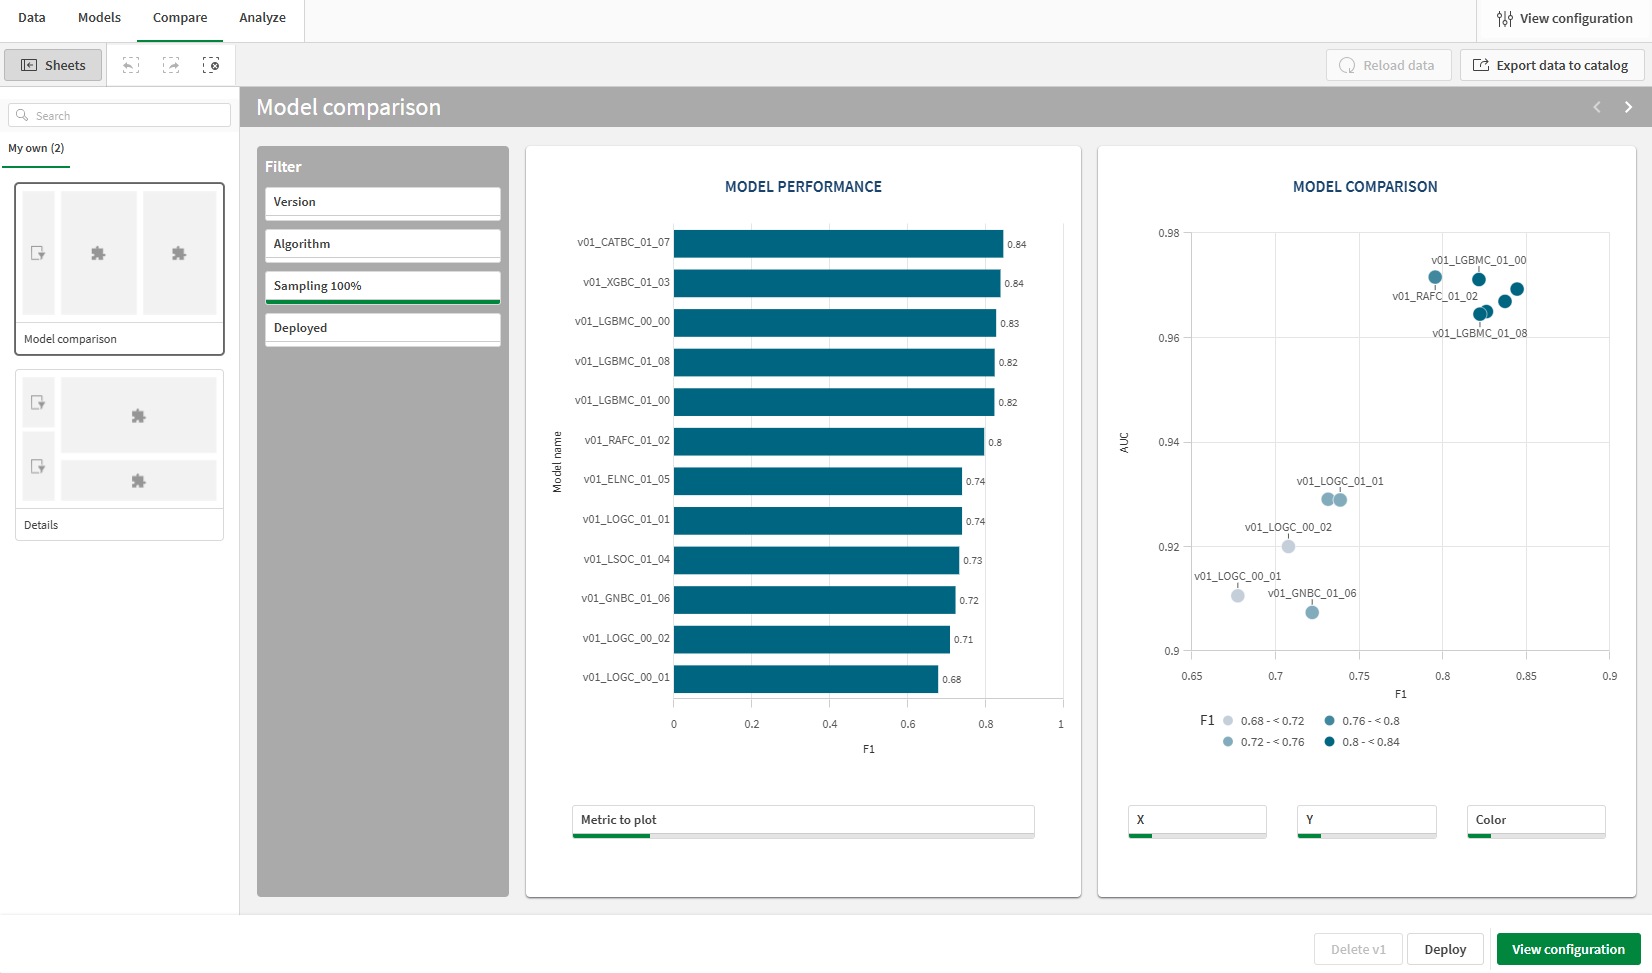
The Model comparison sheet contains interactive charts to visualize how the models compare to one another across the specified metrics. Use the filter panes below each chart to visualize different metrics. Use this customization to show the metrics that are most important for your predictive use case.
Model comparison sheet on Compare tab

Comparing model scores and hyperparameter values
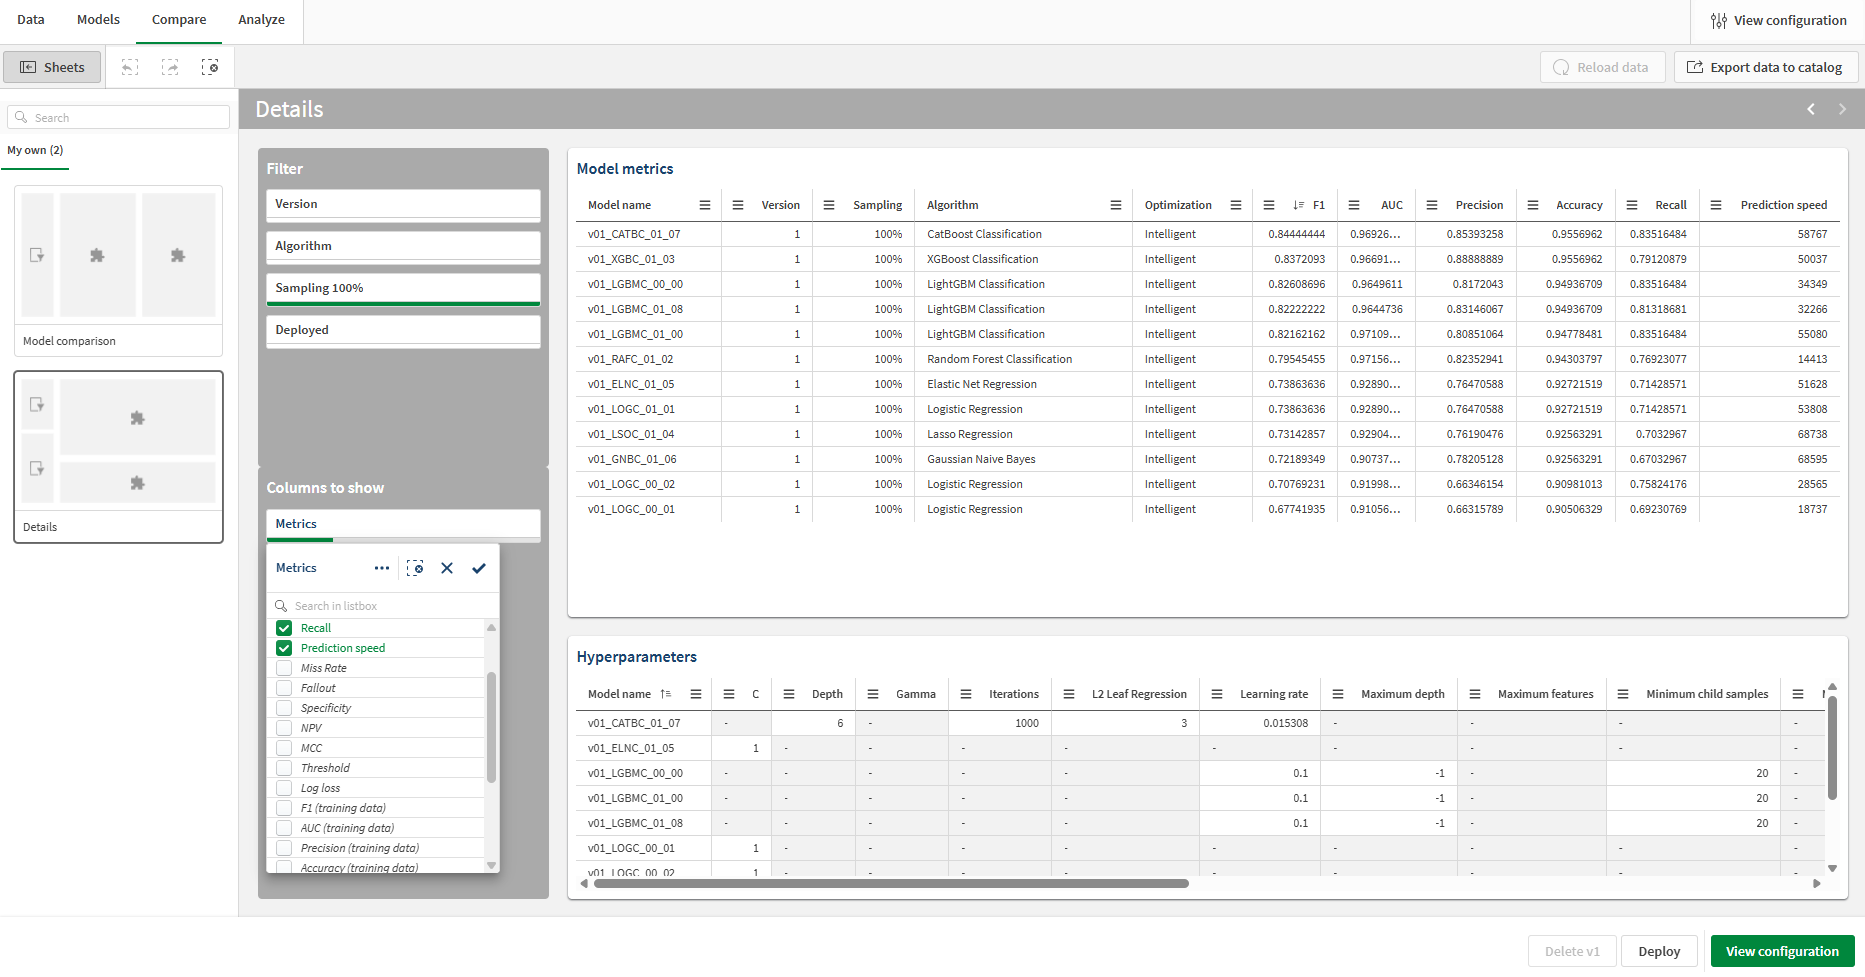
On the Details sheet, model scores and hyperparameters are displayed in tabular format. Using the filter panes on the left side of the sheet, add and remove models and metrics as needed.
Comparing holdout scores and training scores
The Details sheet shows the metrics that are based on the automatic holdout data (data used to validate model performance after training). You can also add the training data metrics to the Model Metrics table for comparison with the holdout scores. These scores will often be similar, but if they vary significantly there is likely a problem with data leakage or overfitting.
Do the following:
-
On the Compare tab, open the Details sheet.
-
In the Columns to show section on left side of the sheet, expand the Metrics filter pane.
-
Select and deselect checkboxes to change the columns as needed. Training data metrics are available to add as columns.
The columns are added to the Model Metrics table.
You can compare all scoring metrics for your models. Add additional metrics to the tables, including training data metrics.

Comparing prediction error for the forecast window
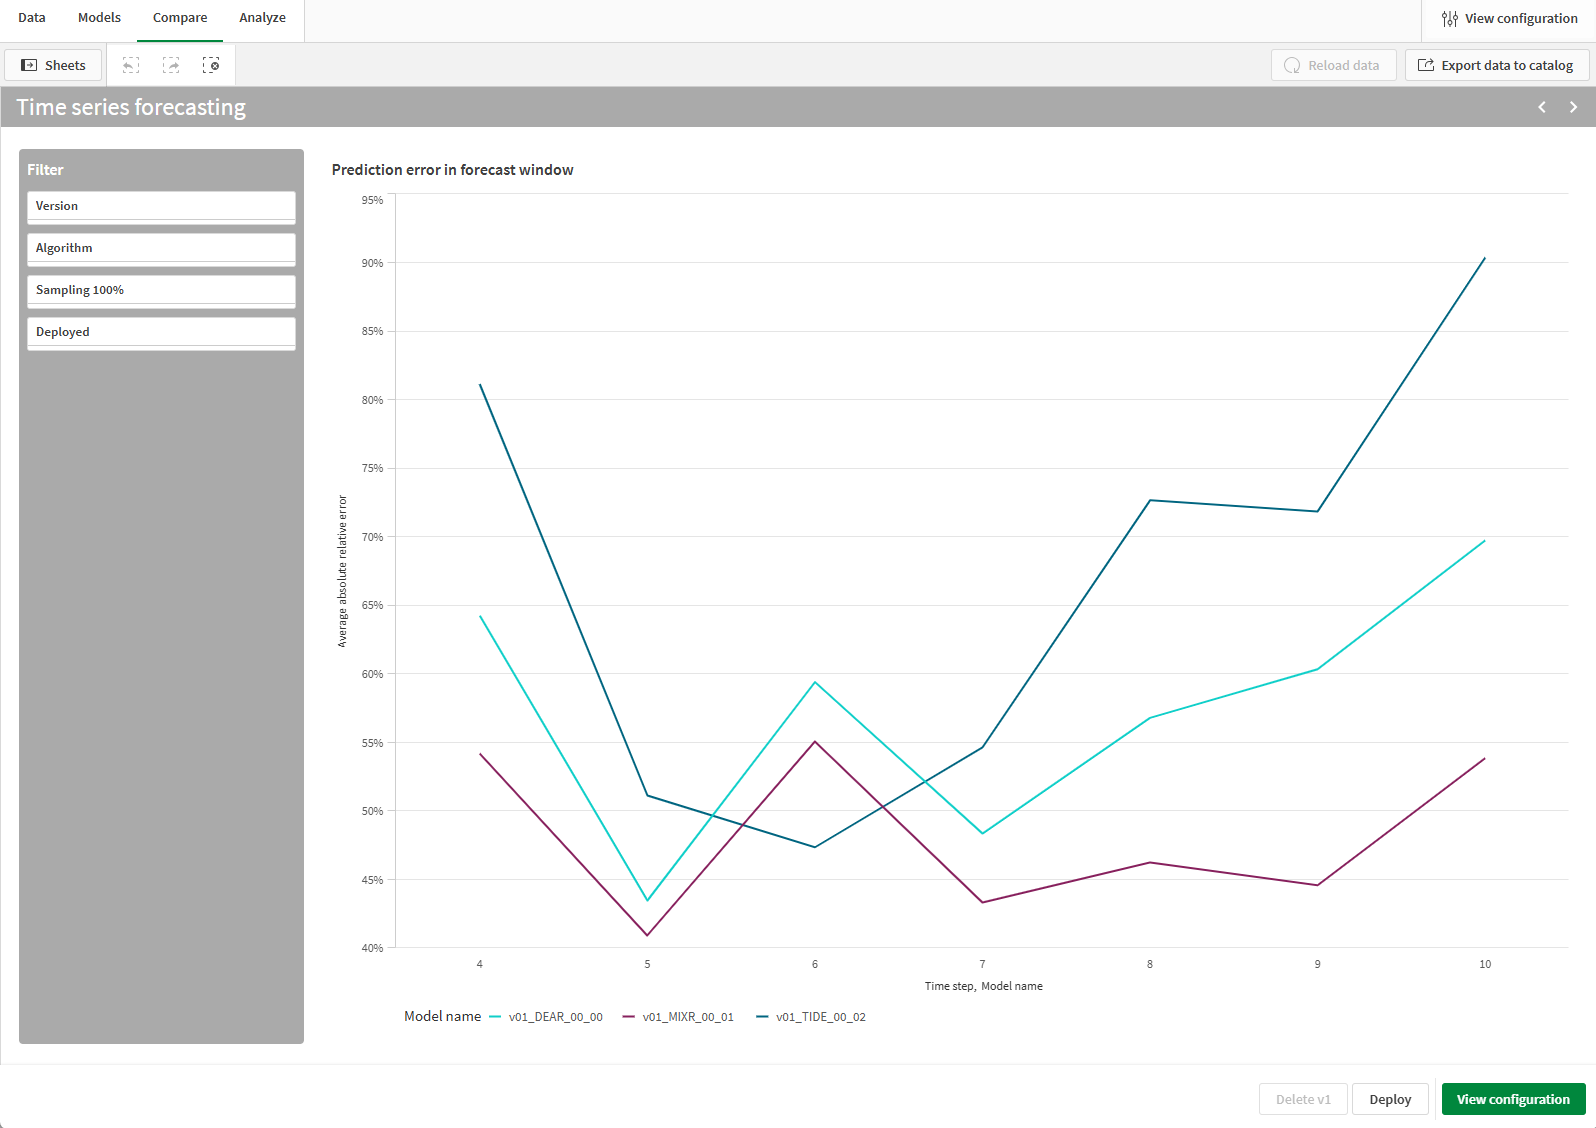
The Time series forecasting sheet is only available for time series experiments. In this sheet, you can analyze the average absolute relative prediction error across each time step in the forecast window. This information is shown individually for each model. This sheet can help you understand where each model is most affected in its prediction quality.
Time series forecasting sheet in model comparison analysis, showing information relevant to a time series experiment.

