Qlik Cloud 簡介
Qlik Cloud 為針對主動智慧建立的資料整合和分析雲端平台。它提供能一起或分開使用的資料整合和分析服務。

開始使用和學習選項
Qlik 技術文件包含旅程中任何階段的所有技能層級的範例、教學課程和疑難排解。

介面概述
首次登入 Qlik Cloud 時,您將會發現教學課程、示範,以協助您開始使用。

Qlik Cloud 政府
Qlik Cloud 政府 與 Qlik 的商用 Qlik Cloud 產品不同。這包括支援美國公部門所需的安全性通訊協定,並獲得 FedRAMP 中度影響等級 (IL) 和國防部 (DOD) IL2 的授權。
正在分析資料
Qlik Cloud 分析 為各式各樣的使用者和使用案例提供現代分析功能——從自助分析到互動式儀表板和應用程式、交談式分析、中繼資料目錄和譜系、行動分析、報告和警示。

使用分析探索資料
處理應用程式和視覺化,以取得資料概述。您可以在資訊充足的情況下做出決定,並查看資料中的關係,以進行探索。

建立分析並視覺化資料
建立強大的分析和資料視覺化。您建置的應用程式針對哪些應用程式使用者可以視覺化資料和進行探索設定了基礎。

載入並模型化分析資料
請先新增資料來源,將資料載入到應用程式中,並開始模型化資料模型。

傳遞資料和譜系進行分析
用來將譜系和內部部署資料載入到 Qlik Cloud 租用戶中的選項。

使用 Qlik Predict 的機器學習
自動化機器學習尋找資料中的模式並用來預測未來資料。
整合資料
Qlik Talend Cloud 透過 Qlik Talend Data Integration 提供即時資料移動、轉換和資料產品。此外,Qlik Talend Cloud 也包括 Talend 的資料監管、資料品質、應用程式整合等功能。

推出資料整合
建立資料管道以執行多種資料整合任務,支援資料架構和分析要求。您也可以使用資料產品簡化資料管理。

什麼是 Qlik Talend Cloud
Qlik Talend Cloud 的更高層級包含 Talend 的更多資料整合功能。這包括提升後的資料監管、資料品質、應用程式整合等功能。

資料整合 影片
觀看某些短片以便順利開始使用整合資料。
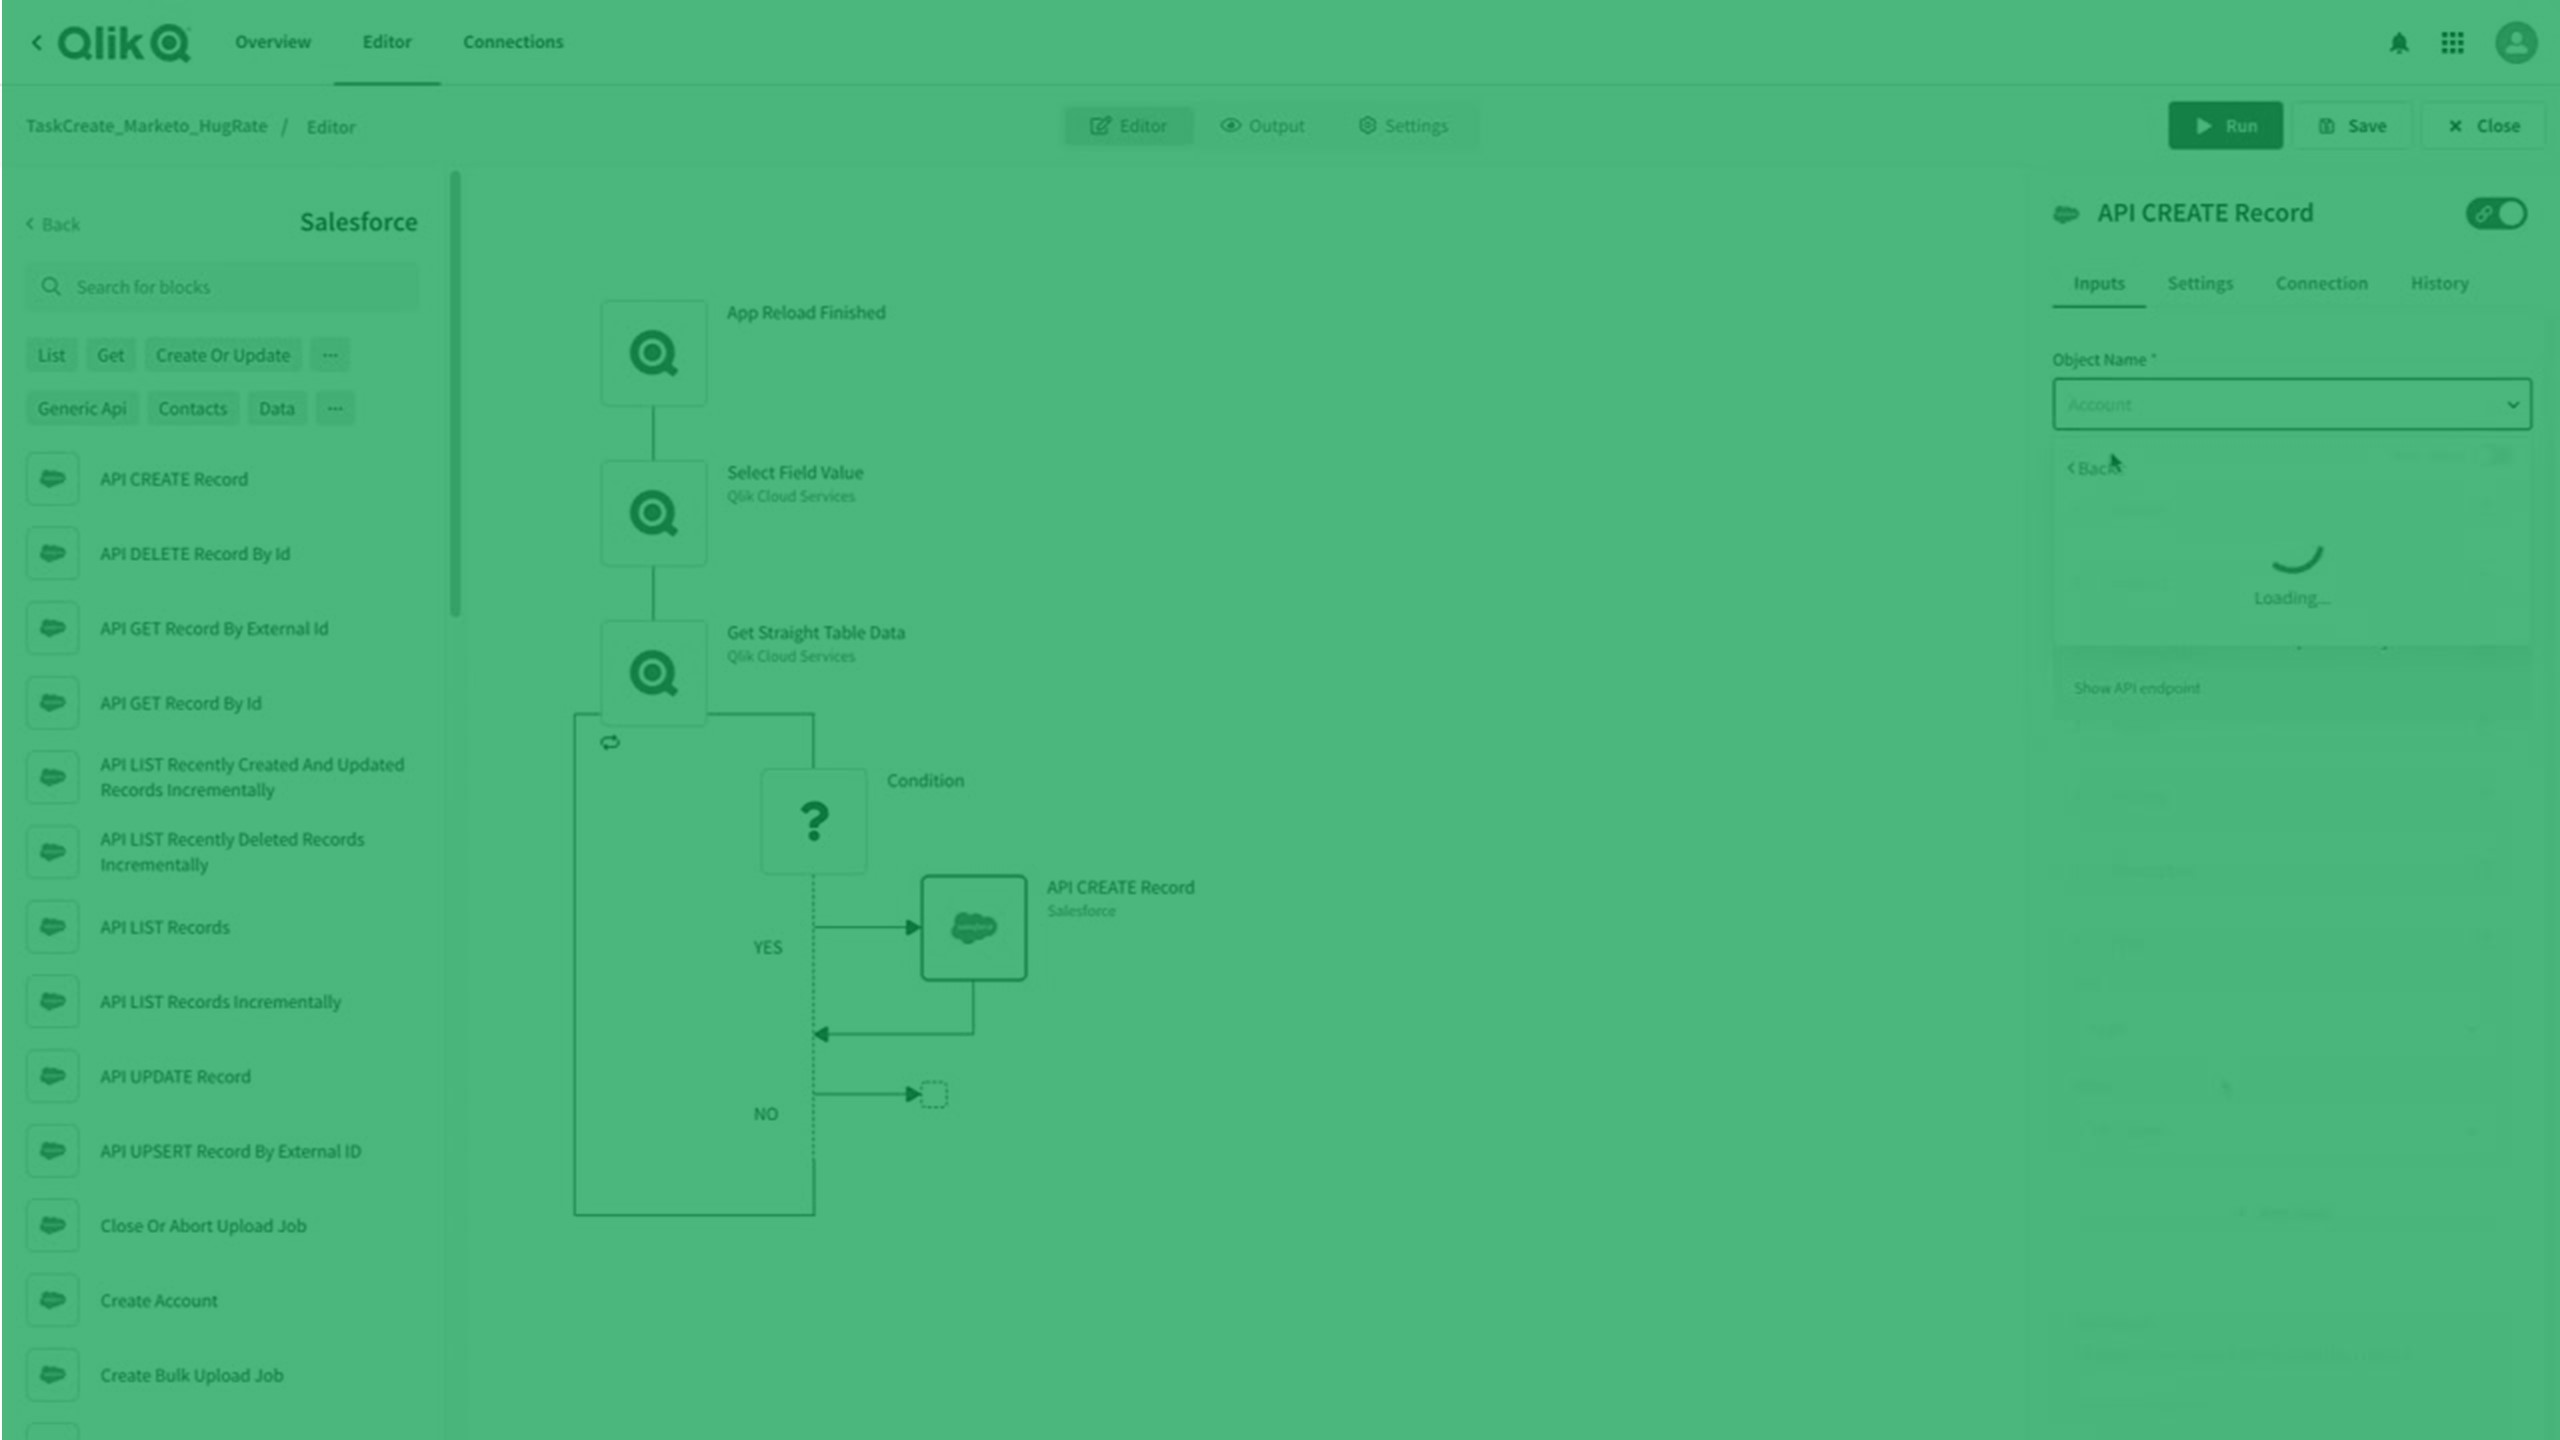
建置自動化
Qlik Automate 提供無代碼視覺介面,能幫助您輕鬆建立自動化分析和資料任務流程。
自動化為如運行專案一般的一系列動作和觸發。這可以是簡單的工作流程,從某個應用程式收集資訊並傳遞至另一個應用程式,或者可以是端對端管道,讓您從原始資格來到 Active intelligence。Qlik Automate 可讓您自動化分析環境、建立資料驅動的工作流程,並在商務流程中內嵌資料和分析。
管理
Qlik Cloud 管理員應負責部署、設定和管理 訂閱和環境。Qlik Cloud 環境提供集中管理和控管,並協助確保使用者採用情形、精確性和系統可靠性。

規劃 Qlik Cloud 部署
若要成功規劃 Qlik Cloud 部署,您將需要考慮公司的地理分佈、現有部署、安全性、容量以及您想要如何管理 Qlik Sense 訂閱和環境等因素。

部署 Qlik Cloud
若要部署 Qlik Cloud,按照高階步驟的標準設定,包括註冊、設定系統、新增使用者和設定管理流程。

管理 Qlik Cloud
Qlik Cloud 環境提供集中管理和控管,並協助確保使用者採用情形、精確性和系統可靠性。管理租用戶涉及管理使用者和資源、安全性設定和一般系統管理。
開發分析和資料整合
使用 Qlik Cloud API 和工具建置、延伸和部署自訂資料驅動式應用程式。您也可以建置 Mashup、即時建立應用程式和視覺化,或在應用程式中內嵌豐富且精彩的分析。
遷移至 Qlik Cloud
造訪遷移中心,讓使用者和管理員快速熟悉 Qlik Cloud。無論您是從 QlikView 或 Qlik Sense Enterprise Client-Managed 移動至 Qlik Cloud 分析,或是從 Stitch 移動至 Qlik Talend Cloud,遷移中心 都會提供有關過渡到新環境時的流程和最佳做法的指引。
其他 Qlik 解決方案
若您正透過 Qlik 用戶端管理的解決方案 (內部部署) 尋求協助,以下是一些前往其他 Qlik 說明系統的直接連結。
- QlikView
- Qlik Sense Enterprise on Windows (使用者)
- Qlik Sense Enterprise on Windows (管理員) (僅提供英文版)
- Qlik Sense Enterprise on Windows (開發人員) (僅提供英文版)
- Qlik NPrinting
- Qlik Replicate (僅提供英文版)
- Qlik 撰寫 (僅提供英文版)
若要檢閱 Qlik 用戶端管理解決方案的文件,請至 Qlik 說明首頁。