Qlik Cloud 简介
Qlik Cloud 是为主动智能构建的数据集成和分析云平台。它提供数据集成和分析服务,可以一起使用或独立使用。

入门和学习选项
Qlik 技术文档包含示例、教程和故障排除,适用于您旅程的任何阶段的所有技能级别。

界面概述
当您第一次登录 Qlik Cloud 时,您将找到教程、演示来帮助您开始使用。

Qlik Cloud 政府
Qlik Cloud 政府 与 Qlik 的商业 Qlik Cloud 产品不同。它包括支持美国公共部门所需的安全协议,并在联邦 RAMP 中度影响级别 (IL) 和国防部 (DOD) IL2 下获得授权。
分析数据
Qlik Cloud Analytics 提供现代分析功能,涵盖全方位的用户和用例 — 从自助服务分析到交互式仪表板和应用程序、会话分析、元数据目录和世系、移动分析、报告和警报。

使用分析来探索数据
可用应用程序和可视化进行工作,以获得您数据的概览。通过揭示数据中的关系,您可以做出明智的决策并得到发现。

创建分析并可视化数据
创建强大的分析和数据可视化。您构建的应用程序为应用程序用户可视化数据和进行发现提供了基础。

分析数据加载和建模
首先添加数据源,将数据加载到应用程序中,然后开始对数据模型建模。

为分析提供数据和世系
将世系和本地数据加载到 Qlik Cloud 租户的选项。

使用 Qlik Predict 进行计算机学习
自动机器学习在您的数据中找到模式,并使用它们对未来数据进行预测。
集成数据
Qlik Talend Cloud 通过 Qlik Talend Data Integration 提供实时数据移动、转换和数据产品。此外,Qlik Talend Cloud 还包括 Talend 数据管理、数据质量、应用程序集成等功能。

引入数据集成
创建数据管道以执行各种数据集成任务,以支持您的数据架构和分析要求。您还可以使用数据产品简化数据管理。

什么是 Qlik Talend Cloud
Qlik Talend Cloud 的更高层包含了更多的 Talend 数据集成功能。这包括增强的数据管理、数据质量、应用程序集成和更多功能。

数据集成 视频
观看一些短视频,以良好的准备开始数据整合。
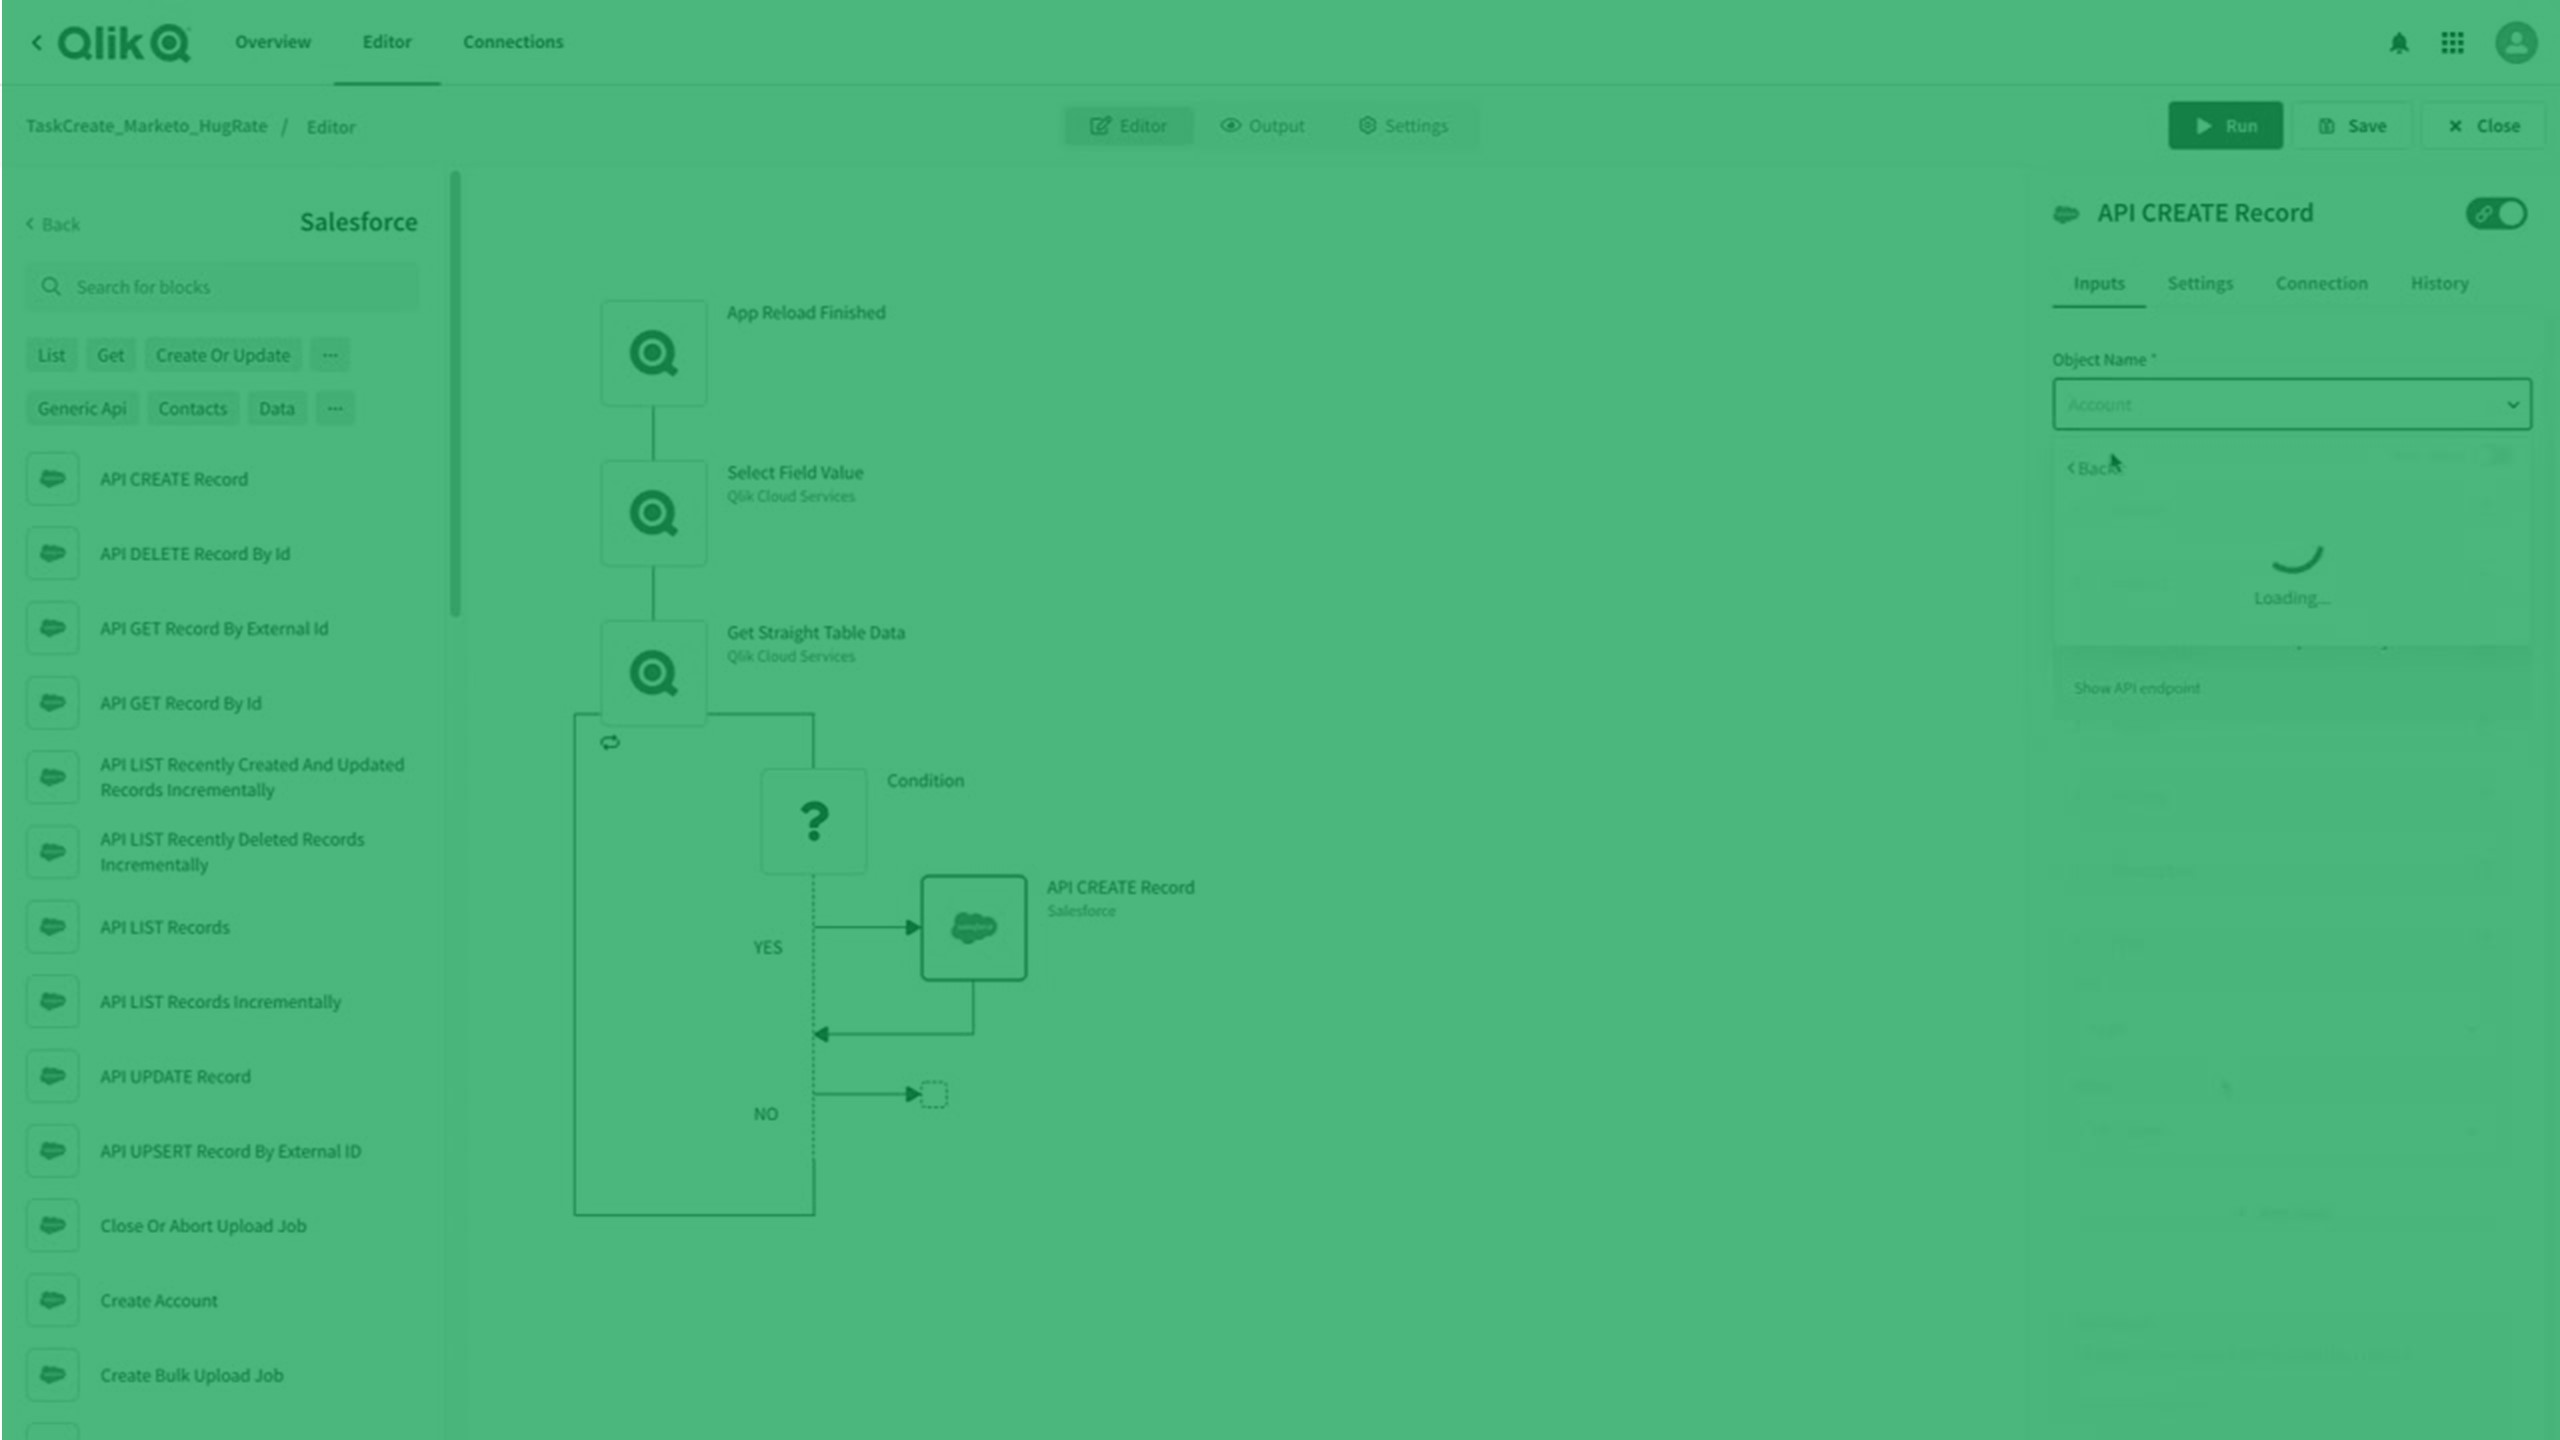
构建自动化
Qlik Automate 提供无代码可视化界面,帮助您轻松构建自动化分析和数据工作流。
自动化是像程序一样运行的一系列操作和触发器。它可以是一个简单的工作流程,从一个应用程序收集信息并将其传递给另一个,也可以是一条端到端的管道,将您从原始数据带到主动智能。Qlik Automate 使您能够自动化分析环境,创建数据驱动的工作流,并将数据和分析嵌入业务流程。
管理
Qlik Cloud 管理员负责部署、配置和管理 预订和环境。Qlik Cloud 环境提供了集中化的管理和治理,有助于确保用户采用、准确性和系统可靠性。

计划您的 Qlik Cloud 部署
要成功规划 Qlik Cloud 部署,您需要考虑公司的地理分布、现有部署、安全性、容量以及您希望如何管理 Qlik Sense 订阅和环境等因素。

部署 Qlik Cloud
要部署 Qlik Cloud,请遵循一组标准的高级步骤,包括注册、配置系统、添加用户和设置管理流程。

管理 Qlik Cloud
Qlik Cloud 环境提供了集中化的管理和治理,有助于确保用户采用、准确性和系统可靠性。管理租户涉及管理用户和资源、安全设置和一般系统管理。
开发分析和数据集成
使用 Qlik Cloud API 和工具来构建、扩展和部署定制的数据驱动应用程序。您还可以构建插件,动态创建应用程序和可视化,或者在应用程序中嵌入丰富的、引人入胜的分析。
迁移到 Qlik Cloud
访问迁移中心,让用户和管理员快速使用 Qlik Cloud。无论您是从 QlikView 或 Qlik Sense Enterprise Client-Managed 迁移到 Qlik Cloud Analytics 还是从 Stitch 迁移到 Qlik Talend Cloud,迁移中心 都可以在过渡到新环境时提供有关流程和最佳实践的指导。
其他 Qlik 解决方案
如果您正在寻找 Qlik 客户端托管解决方案(内部部署)方面的帮助,这里有一些指向其他 Qlik 帮助系统的直接链接。
- QlikView
- Qlik Sense Enterprise on Windows(用户)
- Qlik Sense Enterprise on Windows(管理员) (仅提供英文版本)
- Qlik Sense Enterprise on Windows(开发者) (仅提供英文版本)
- Qlik NPrinting
- Qlik Replicate (仅提供英文版本)
- Qlik Compose (仅提供英文版本)
要查看 Qlik 客户端管理的解决方案的文档,请访问 Qlik 帮助主页。