Qlik Cloud へようこそ
Qlik Cloud は、データ統合と分析のための唯一のエンドツーエンド ソリューションによって提供されるアクティブ インテリジェンスにより、データ、洞察、アクション間のギャップを埋めます。
Qlik Cloudの概要
Qlik Cloud は、アクティブ インテリジェンス向けに構築されたデータ統合および分析クラウド プラットフォームです。併用または単独で使用できるデータ統合および分析サービスを提供します。

はじめにと学習オプション
Qlik テクニカル ドキュメントには、プロセスのあらゆる段階のすべてのスキル レベルの例、チュートリアル、トラブルシューティングが含まれています。

インターフェースの概要
Qlik Cloud に初めてログインすると、開始方法を説明するチュートリアル、デモが表示されます。

Qlik Cloud Government
Qlik Cloud Government は、Qlik の商用の Qlik Cloud 製品とは異なります。米国の公共部門をサポートするために必要なセキュリティ プロトコルが含まれ、FedRAMP の中程度の影響レベル (IL) および国防総省 (DOD) IL 2 で承認されています。
データの分析
Qlik Cloud Analytics は、セルフサービス分析からインタラクティブなダッシュボードとアプリケーション、対話型分析、カスタム分析と組み込み分析、モバイル分析、レポート作成、およびアラートまで、幅広いユーザーおよびユースケースに対して現代的な分析機能を提供します。

分析を使用したデータの探索
アプリとビジュアライゼーションを使用して作業し、データの概要を把握できます。データ内の関係性を見ることにより、情報に基づいた意思決定と発見ができます。

分析の作成とデータの視覚化
強力な分析と データビジュアライゼーションを提供しています。構築したアプリは、ユーザーがデータを視覚化して発掘するための基盤となります。

分析データのロードとモデリング
最初にデータ ソースを追加し、データをアプリにロードして、データ モデルのモデリングを開始します。

分析用のデータと系列の提供
系列とオンプレミスデータを Qlik Cloud テナントにロードするためのオプション。

を使った機械学習Qlik Predict
自動化された機械学習は、データのパターンを見つけ出し、それを使って将来のデータを予測します。
データの統合
Qlik Talend Cloud は、Qlik Talend Data Integration を使用したリアルタイムのデータ移動、変換、データ製品を提供します。さらに、Qlik Talend Cloud には、データ スチュワードシップ、データ品質、アプリ統合などの Talend 機能も含まれています。

データ統合の紹介
データ アーキテクチャと分析の要件をサポートする、さまざまなデータ統合タスクを実行するためのデータ パイプラインを作成します。データ製品を使用してデータ管理を効率化することもできます。

Qlik Talend Cloud とは
Qlik Talend Cloud の上位のティアには、より多くの Talend のデータ統合機能が含まれています。これらの機能には、強化されたデータ スチュワードシップ、データ品質、アプリ統合などが含まれます。

データ統合 ビデオ
データ統合を円滑に始めるために短いビデオを何本かご覧ください。
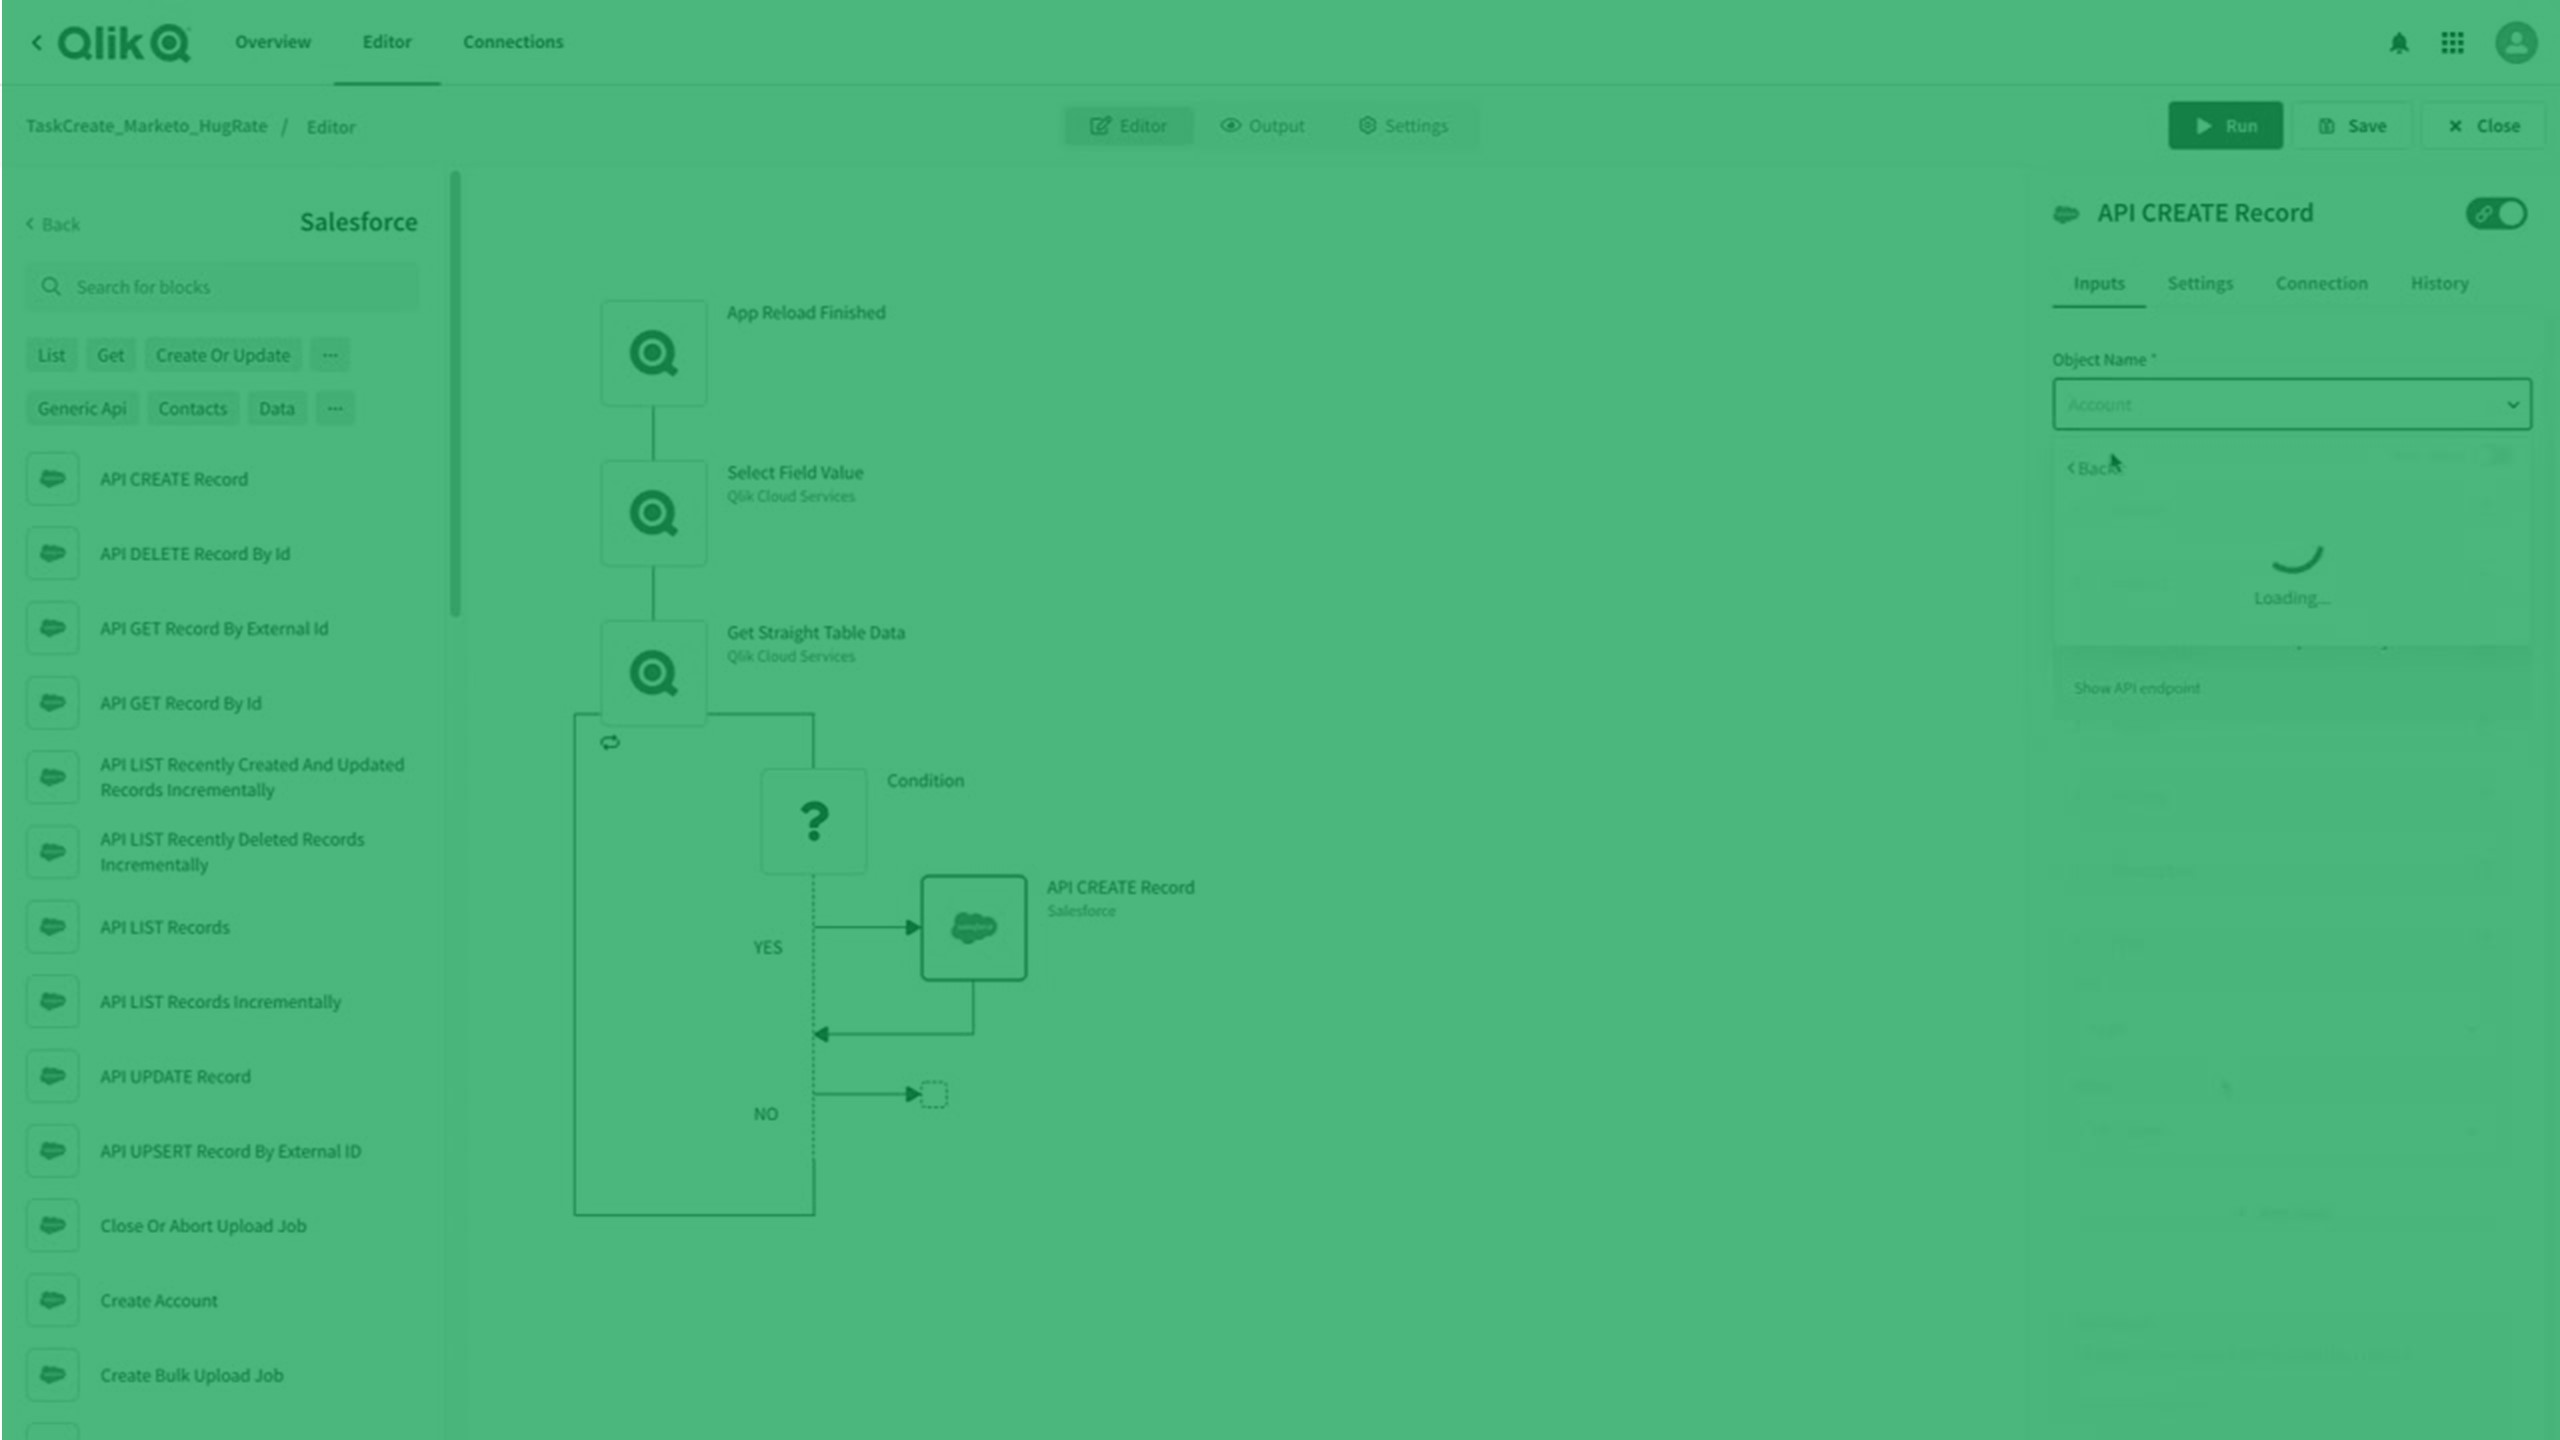
自動化の構築
Qlik Automate は、自動化された分析とデータ ワークフローを簡単に構築できる、ノーコードのビジュアル インターフェースです。
自動化されると、一連のアクションとトリガーがプログラムのように実行されます。あるアプリケーションから情報を収集して別のアプリケーションに渡す単純なワークフローの場合もあれば、生データからアクティブなインテリジェンスに移行するエンドツーエンドのパイプラインの場合もあります。Qlik Automate により、分析環境を自動化し、データ駆動型のワークフローを作成して、データと分析をビジネス プロセスに組み込むことができます。
管理
管理者は、 Qlik Cloud サブスクリプションと環境の展開、設定、管理を担当します。Qlik Cloud 環境は、一元的な管理と統制を提供し、ユーザーの採用、正確性、およびシステムの信頼性を確実にします。

Qlik Cloud 展開の計画
Qlik Cloud 展開の計画を成功させるには、会社の地理的分布、既存の展開、セキュリティ、容量、Qlik Sense サブスクリプションと環境の管理方法なの要素を考慮する必要があります。

の展開Qlik Cloud
Qlik Cloud を展開するには、登録、システムの構成、ユーザーの追加、管理プロセスの設定など、標準的な一連の高レベルの手順に従います。

の管理Qlik Cloud
Qlik Cloud 環境は、一元的な管理と統制を提供し、ユーザーの採用、正確性、およびシステムの信頼性を確実にします。テナントの管理には、ユーザーとリソースの管理、セキュリティ設定、および一般的なシステム管理が含まれます。
開発分析とデータ統合
Qlik Cloud API とツールを使用して、カスタム データ駆動型アプリケーションを構築、拡張、展開します。また、マッシュアップを構築したり、アプリやビジュアライゼーションをその場で作成したり、豊富で魅力的な分析をアプリケーションに組み込むこともできます。
Qlik Cloud への移行
[移行センター] にアクセスし、ユーザーと管理者が Qlik Cloud をすぐに使用できるようにします。QlikView または Qlik Sense Enterprise Client-Managed から Qlik Cloud Analytics に移行する場合でも、Stitch からQlik Talend Cloud に移行する場合でも、移行センター に、新しい環境に移行する際のプロセスやベストプラクティスに関するガイダンスが提供されています。
その他の Qlik ソリューション
Qlik クライアント管理のソリューション (オンプレミス) の支援をお探しの場合は、他の Qlik ヘルプ システムへの直接リンクをいくつかご紹介します。
- QlikView
- Qlik Sense Enterprise on Windows (ユーザー)
- Qlik Sense Enterprise on Windows (管理者)
- Qlik Sense Enterprise on Windows (開発者) (英語のみ)
- Qlik NPrinting
- Qlik Replicate (英語のみ)
- Qlik Compose (英語のみ)
Qlik クライアント管理ソリューションのドキュメントを確認するには、[Qlik ヘルプのホームページ] にアクセスしてください。