A chart (visualization) expression is a combination of functions, fields, and mathematical operators (+ * / =), and other measures. Expressions are used to process data in the application in order to produce a result that can be seen in a visualization. They are not limited to use in measures. You can build visualizations that are more dynamic and powerful, with expressions for titles, subtitles, footnotes, and even dimensions.
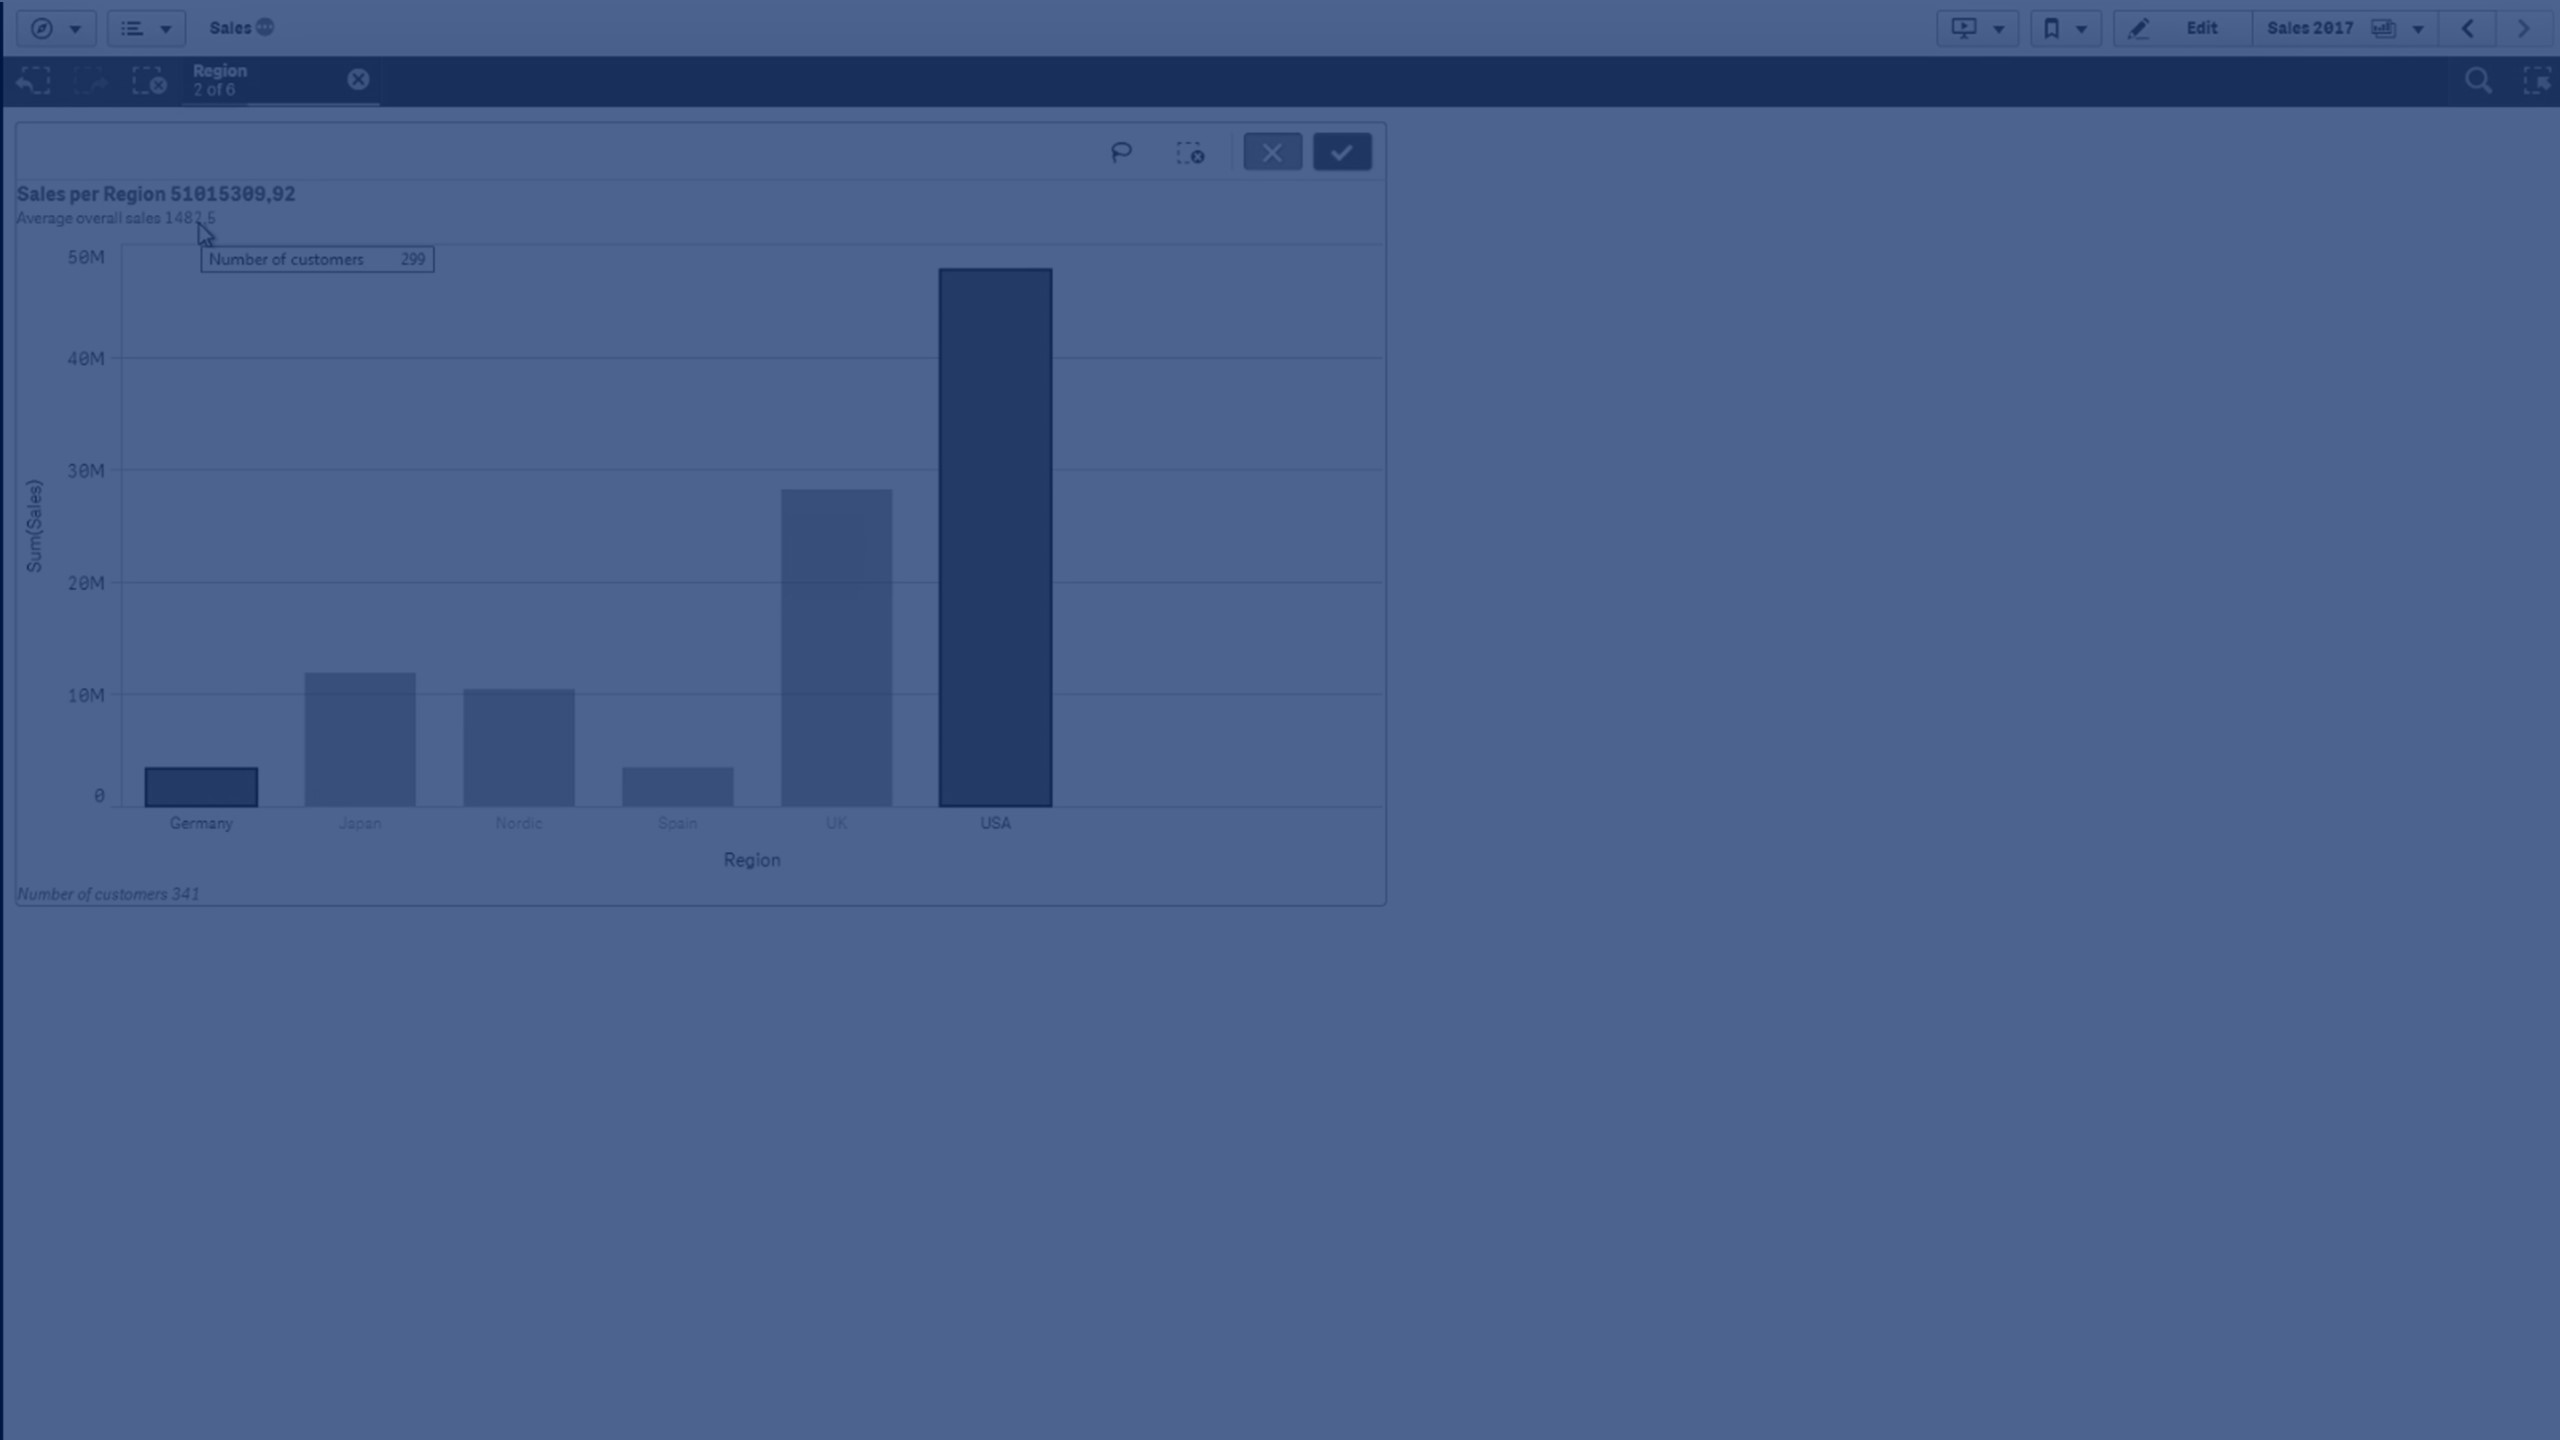
This means, for example, that instead of the title of a visualization being static text, it can be made from an expression whose result changes depending on the selections made.