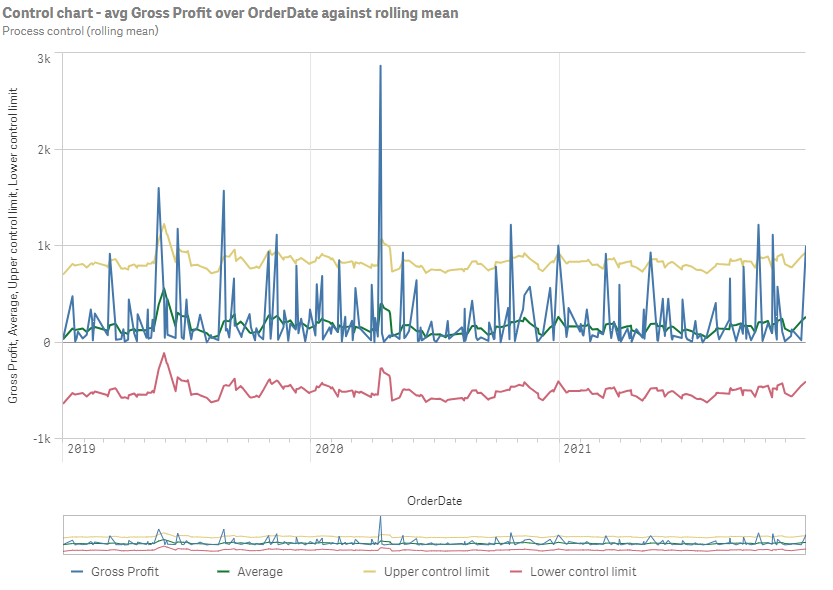
Process control (rolling mean) analysis
Show the performance of a measure over time between two calculated control limits.
Process control (rolling mean) monitors data against expected statistical ranges based on nearby values.
Process control (rolling mean) analysis

Creating process control (rolling mean) analyses
Do the following:
-
In Assets, click Analysis.
-
Drag and drop Process control (rolling mean) into the sheet.
-
Click Add dimension and select a temporal dimension.
-
Click Add measure and a select a measure.
-
Optionally, in the properties panel, under Analysis properties, adjust the slider under Sigma.
-
Optionally, to add an analysis period, do the following:
-
In the properties panel, under Analysis properties, turn on Analysis period.
-
Under Calendar period, select the calendar period to use.
-
Under Period, select a specific period to use.
Information noteAnalysis periods requires calendar periods in the logical model. For more information, see Defining analysis periods with calendar periods. -
-
Optionally, in the properties panel, under Appearance, adjust the appearance of the analysis.
