
Example - Creating a Word report
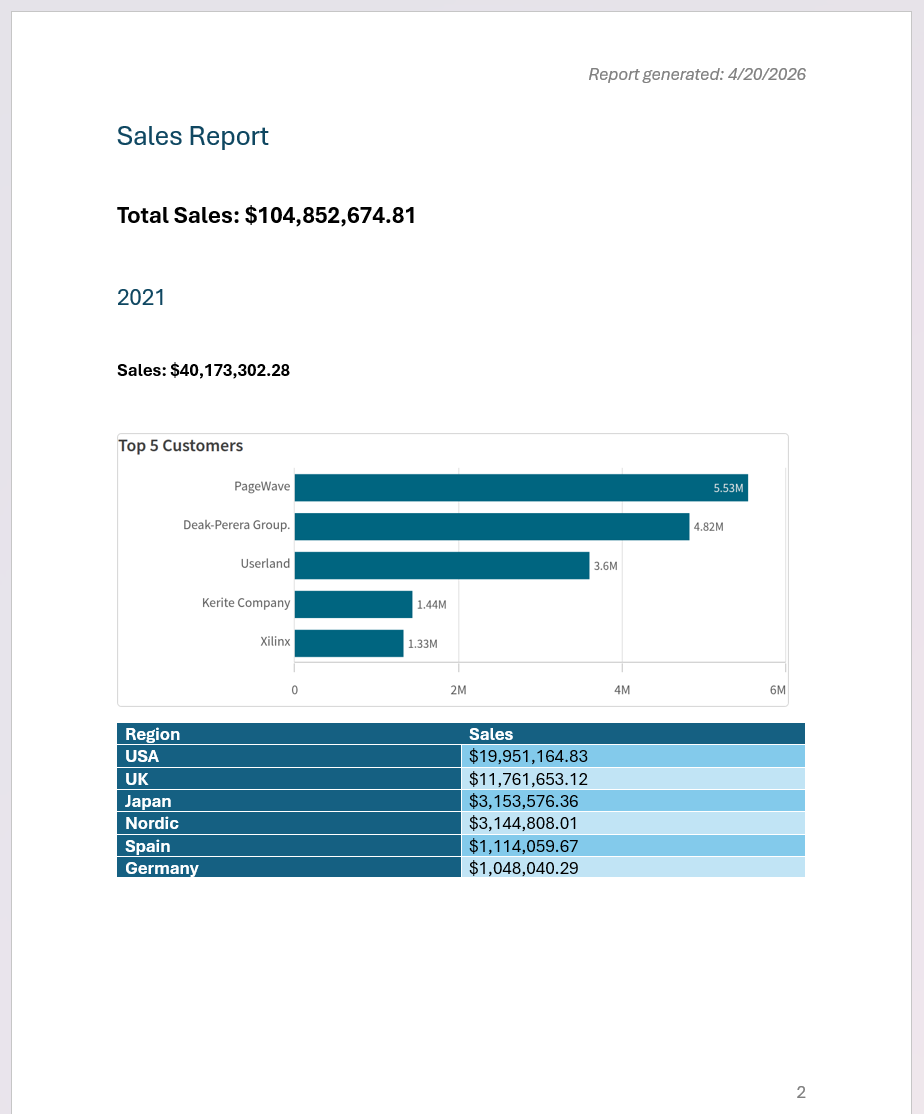
Last updated: 10/16/2026In this example, you will build a Word-based report to analyze sales by year, region, and customer.
Word report result.
Before you start
Create a new template
Get started
Do the following:
-
Open Microsoft Word and create a new DOCX file. This will be your template file.
-
Click the Qlik add-in icon in the ribbon bar under the Home tab.
Open the Qlik add-in by clicking the Qlik icon in the ribbon bar

-
Log in to the add-in using your Qlik Cloud credentials.
Connect to the application
Do the following:
-
Select the Space where you have uploaded the application.
-
Under App, select the application.
-
Click Save.
Connecting to the uploaded application in the template
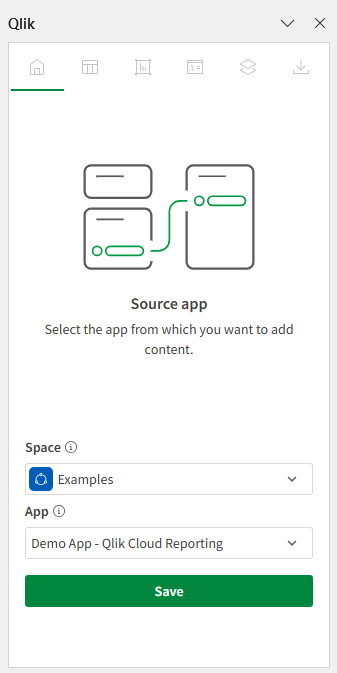
The template is now connected to the application.
Setting up the report
Do the following:
-
Add a title to the report—for example, Sales Report. Format the title as desired.
Add a level
With levels, you can automate the creation of filtered sections, cycling report data for each dimension or chart value. A level creates a new section for each dimension or chart value.
Add a page object to generate a separate section for each year.
Do the following:
-
Add new lines below the title you created earlier.
-
In the add-in, click the
 icon on the top toolbar.
The Levels and pages section opens.
-
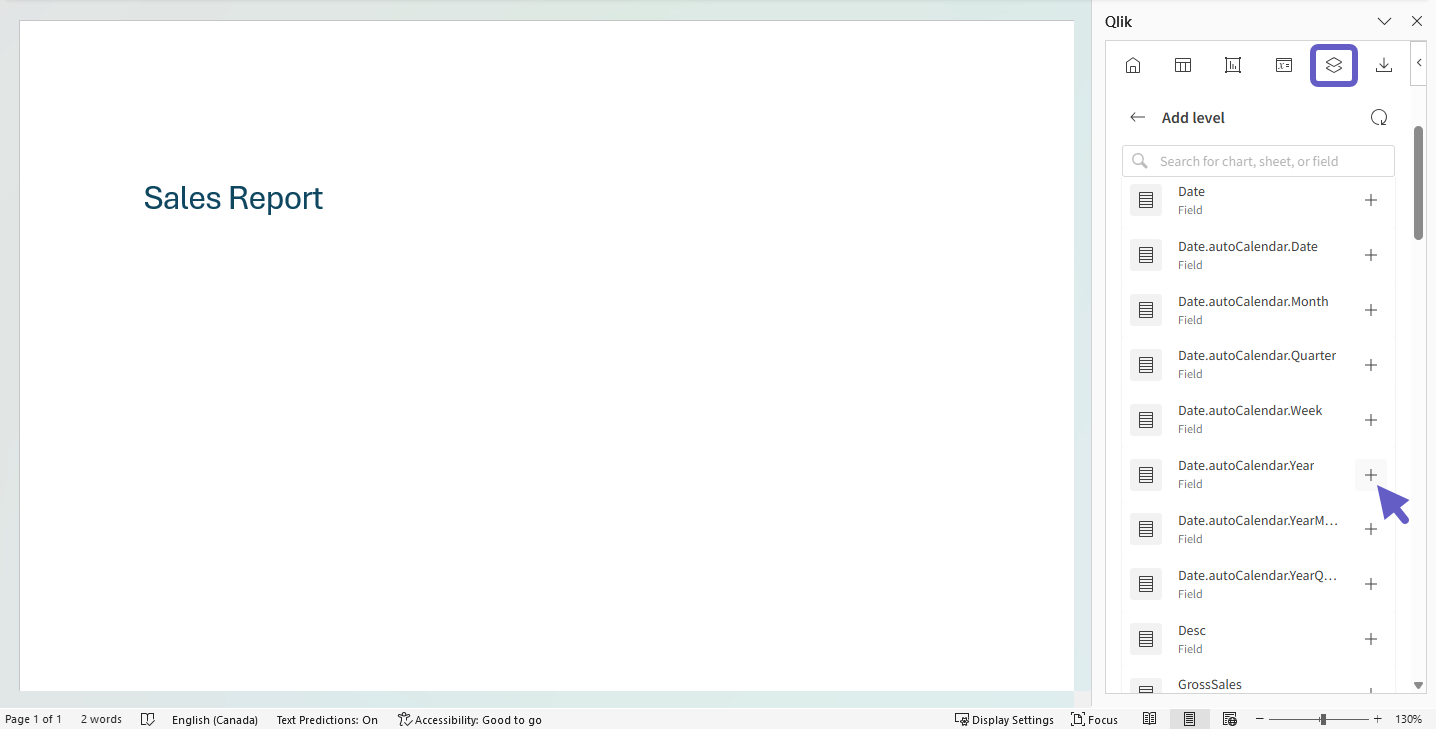
Click Add level.
-
Expand Fields.
-
Click
 next to Date.autoCalendar.Year.
Selecting the field to use for the level
-
Under Select fields to add (optional), check the box for Date.autoCalendar.Year.
-
Click Add.
Add expressions
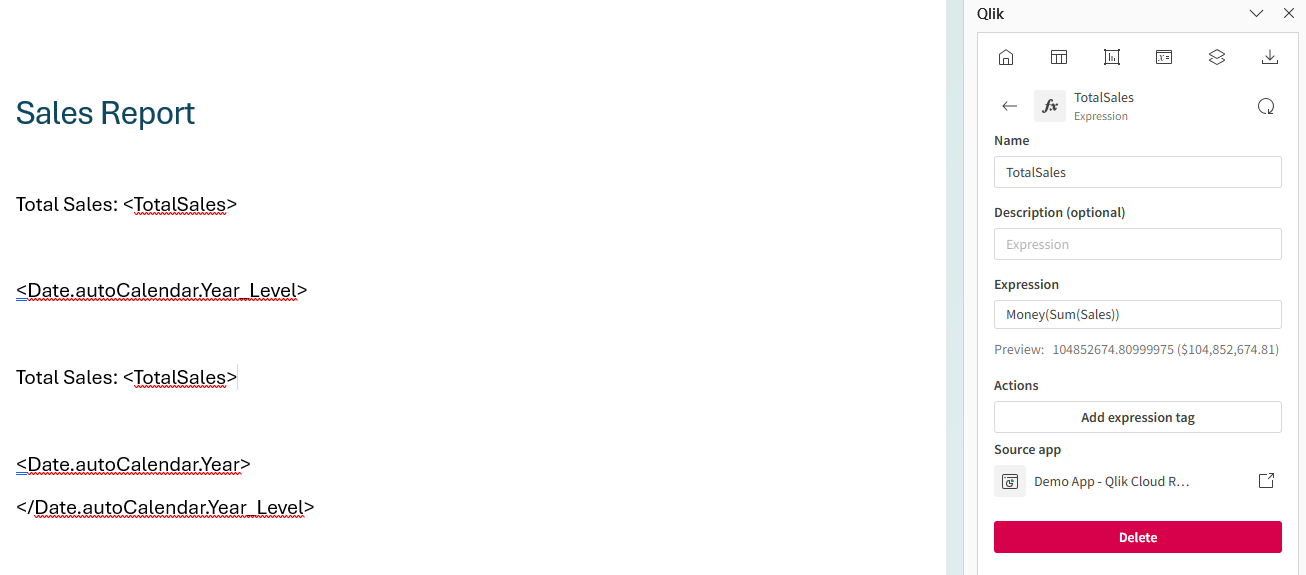
Add expressions to provide high-level information about sales. You can reuse the same expression, placing it once at the top of the report (for all-time total sales), and once inside the level (for total sales per year).
Do the following:
-
Place your cursor above the opening <Date.autoCalendar.Year_Level> tag of the level.
-
Press Enter to create a few new lines.
-
Type the following:
Total Sales: -
In the add-in, click the
 icon on the top toolbar.
The Variables and expressions section opens.
-
Click Add expression.
-
Under Name, type TotalSales.
-
Under Expression, add the following:
Money(Sum(Sales)) -
Click Create.
-
Under Select fields to add (optional), check the box for Date.autoCalendar.Year.
-
Click Add.
-
Add a few new lines between the <Date.autoCalendar.Year_Level> and <Date.autoCalendar.Year> tags.
-
Type the following:
Total Sales: -
In the add-in, click the
icon on the top toolbar.The Variables and expressions section opens.
-
Next to the TotalSales expression you just created, click
 .
. -
Click Add expression tag.
Template with expressions inserted.
Add a chart image
Do the following:
-
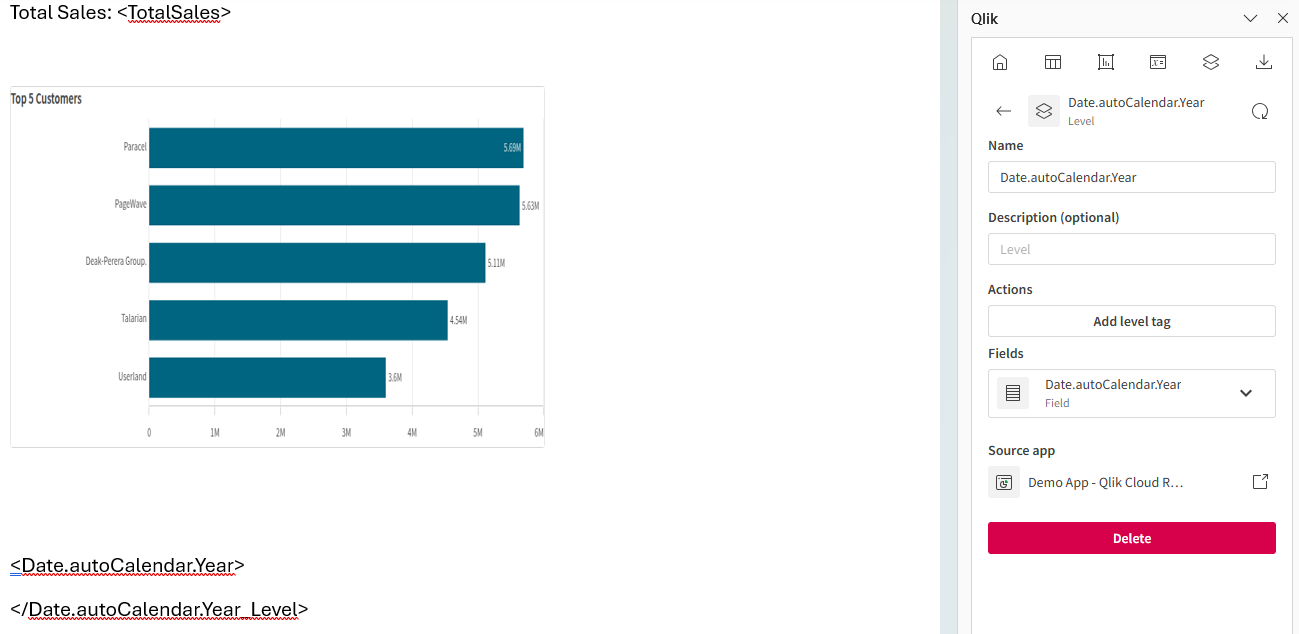
Add a few new lines below the second Total Sales: <TotalSales> line.
-
In the add-in, click the
 icon on the top toolbar.
The Charts section opens.
-
Click Add chart.
A list of available sheets appears.
-
Expand the Dashboard sheet.
-
Click
next to the Top 5 Customers chart. -
Resize the chart as desired.
Template with chart image added.
Add a table
Do the following:
-
Place your cursor below the chart image you just inserted.
-
In the add-in, click the
 icon on the top toolbar.
The Tables section opens.
-
Click Add table.
A list of available sheets appears.
-
Expand the Dashboard sheet.
-
Click
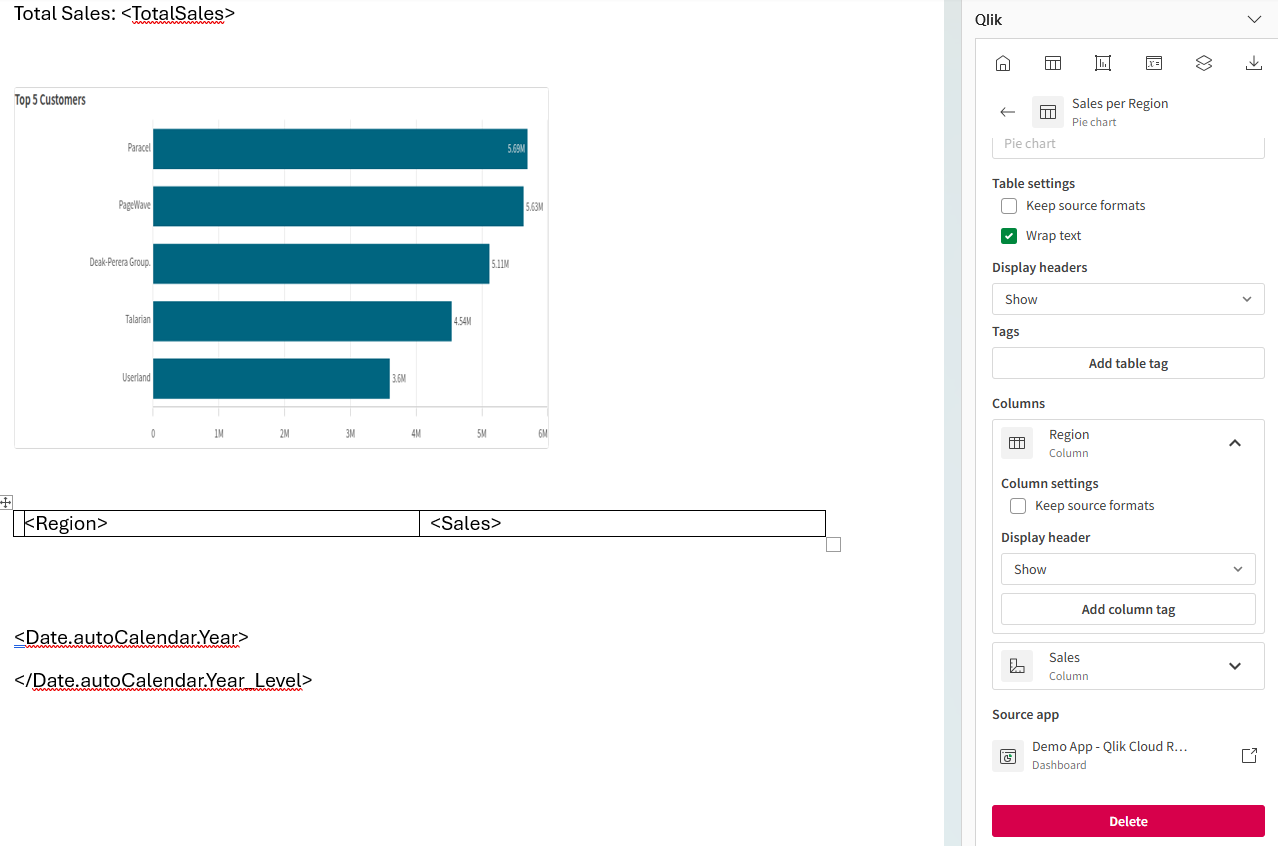
next to the Sales per Region chart, and select Individual columns. -
Under Select columns to add, check All.
-
Click Add.
All columns from the source chart are added as individual columns in a Word table.
-
Move and resize the table so it takes up the remaining space below the titles.
Template with chart image added.
Add a variable in the document header
You can add variables from the analytics application to the report. Variables store values that can change dynamically. Add a variable that has been added to the application, storing today's date. It can be added to the document header so that each page contains the date of report generation.
Do the following:
-
Double-click the top of document canvas to select the document header. This is where the variable will be inserted.
-
In the add-in, click the
icon on the top toolbar.The Variables and expressions section opens.
-
Click Add variable.
A list of available variables appears.
-
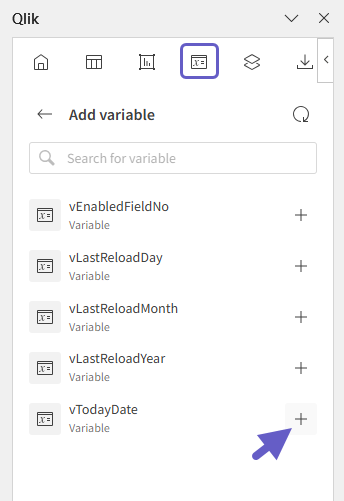
Click
next to vTodayDate .Selecting the variable to use
Preview the report
Use the Word-native features to finalize the document presentation. For example, you can:
- Set formatting, styling, and spacing as desired.
-
Add auto-generated page numbers in the footer.
-
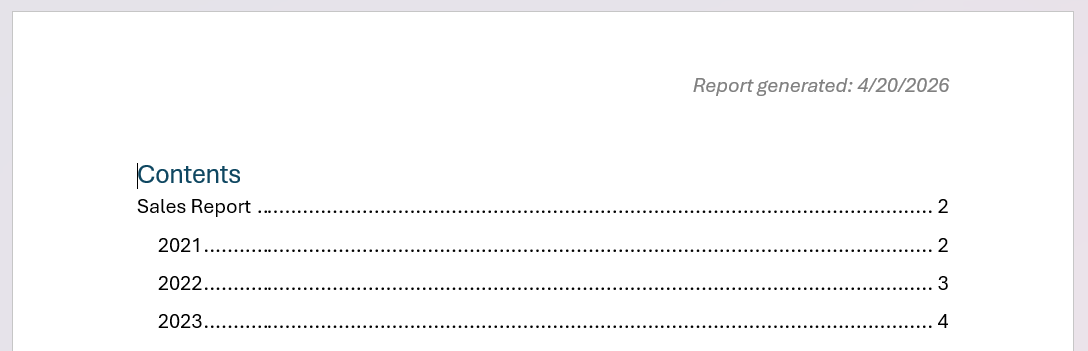
Add a table of contents at the top of the document (formatting field tags with header styles ensures these items will be captured in the table of contents).
-
Insert a page break within the level tag to break each cycle of the level into its own page.
Page 1 of Word report template ready to preview, containing table of contents

Page 2 of Word report template ready to preview, containing tags and chart images.

When ready, preview the report as a Word file to ensure it looks as expected.
Do the following:
-
In the add-in, click the
 icon on the top toolbar.
The Preview section opens.
-
Click Preview as Word (.docx).
Page 1 of Word report result.
Page 2 of Word report result.
Next steps
The next step is to upload the template to the application.
After uploading the template, you could:
-
Configure a distribution list and report task, and set the report up to generate on a schedule.
-
Enable the template for on-demand reporting.