Sheet view
App developers add visualizations and other elements to sheets in an app. App consumers interact with the sheet for data analysis. App developers and app consumers can interact with Insight Advisor to generate visualizations using natural language queries.
Click Sheet under the Analyze tab in the navigation bar to open a sheet.
Develop sheets in edit mode. Interact with sheets in analyze mode. Explore your data with Insight Advisor in Insight Advisor.
Edit
Click Edit to edit a sheet.
Sheet view in edit mode
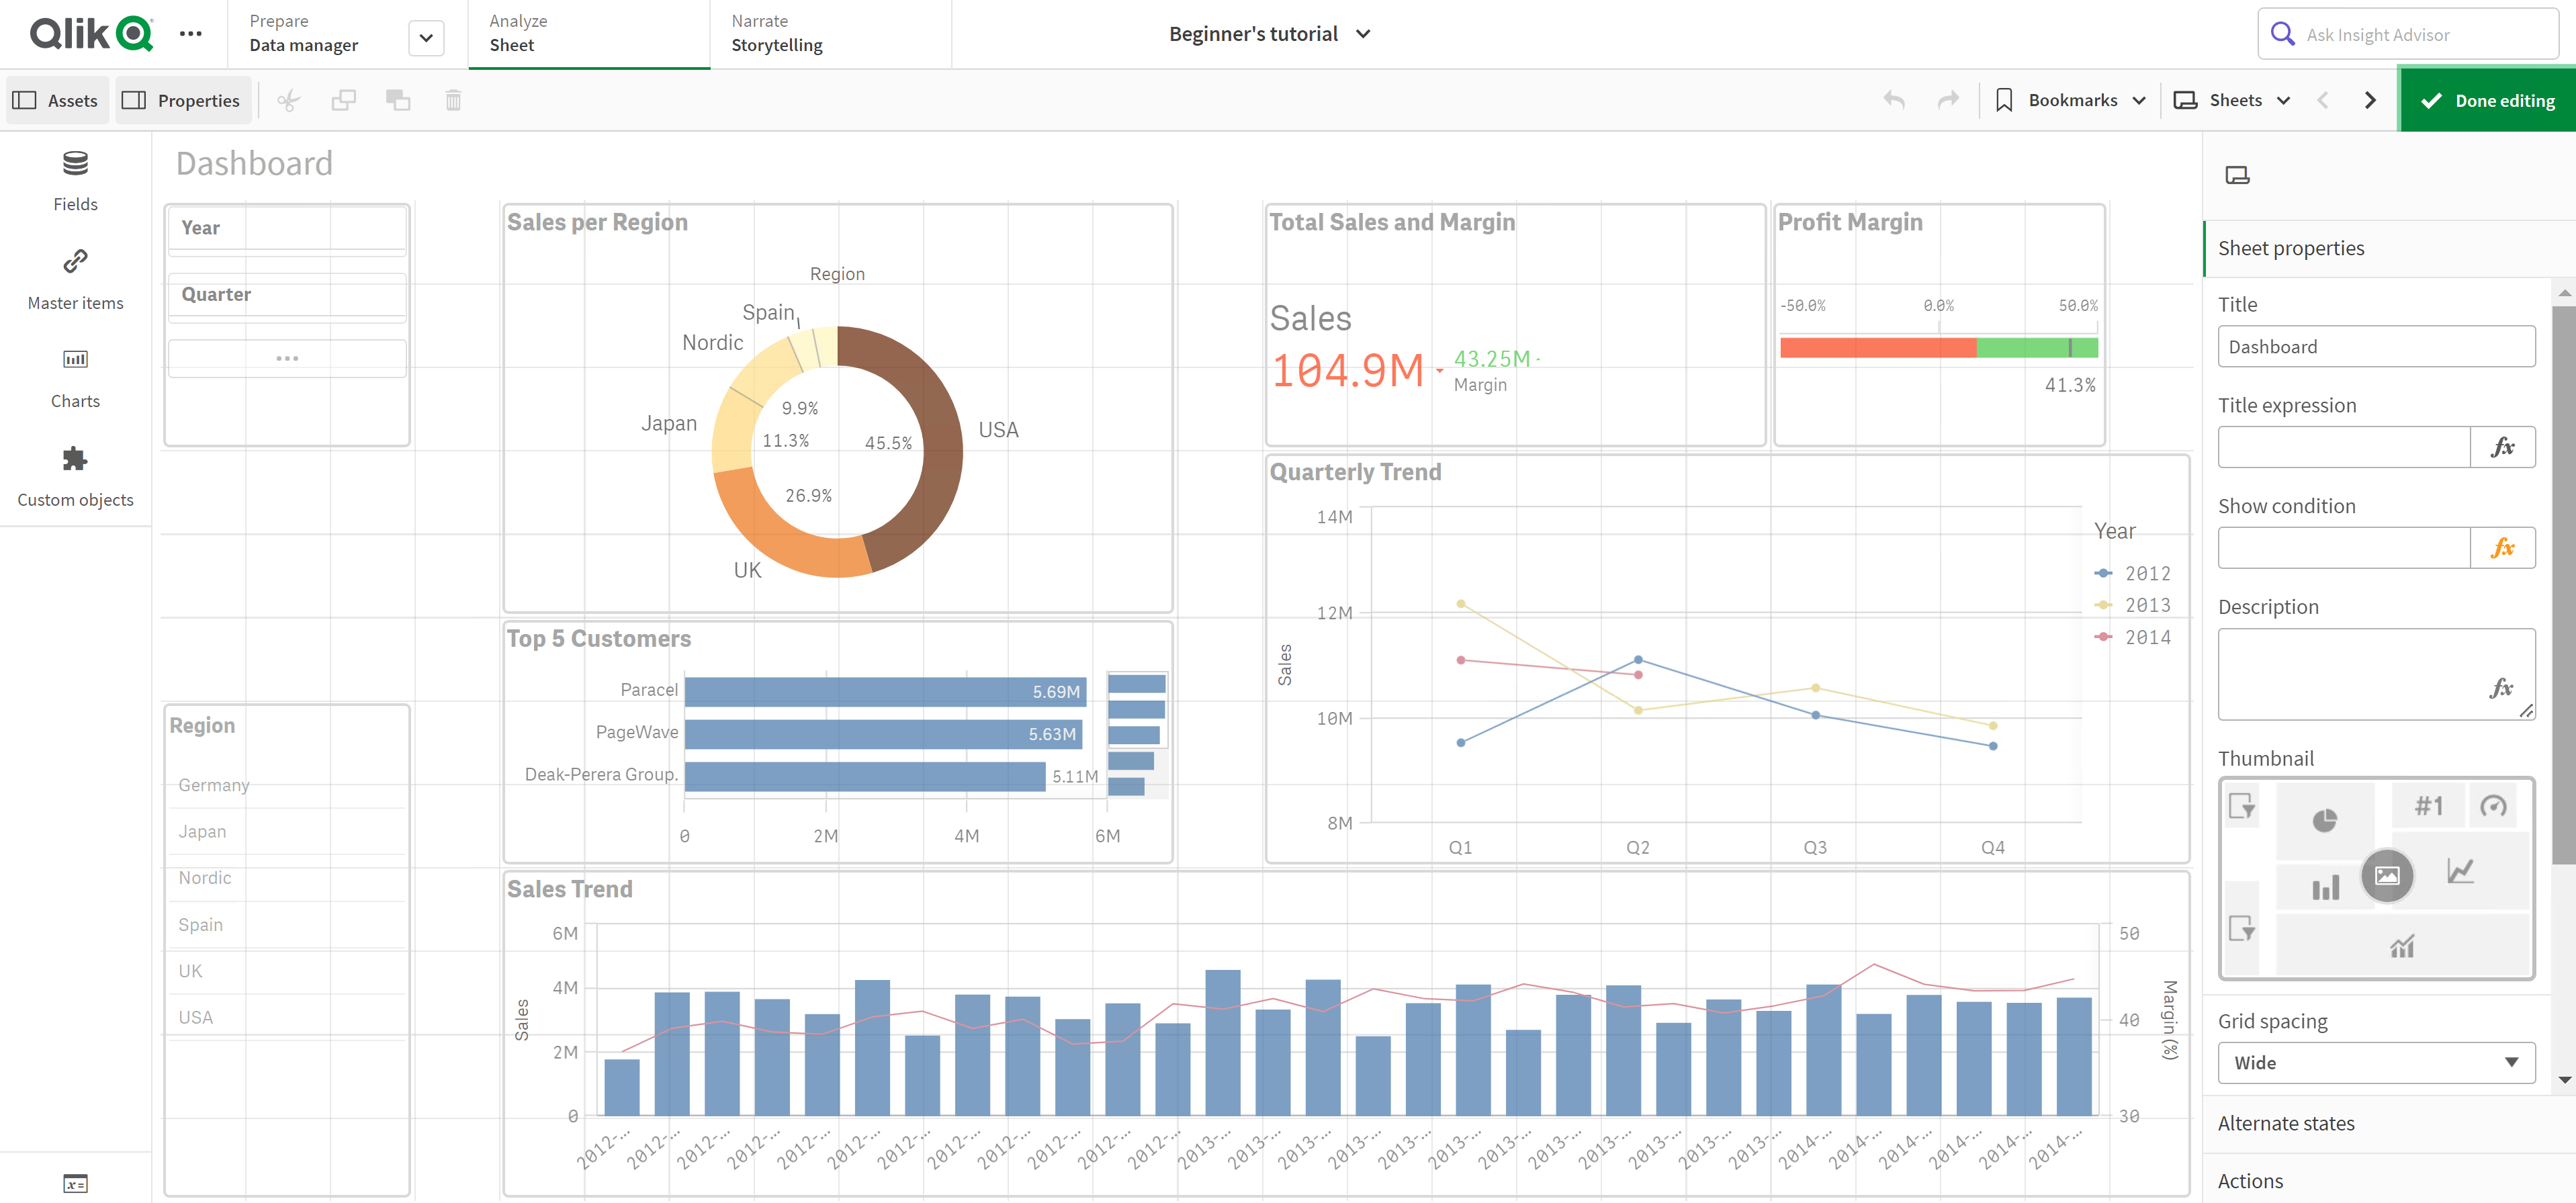
You can do the following:
-
Click Sheets to add a new sheet, or to navigate to a sheet.
-
Click Assets to open the assets panel. Add assets to your sheet. For example, you can add a visualization to a sheet. See: Assets panel
For assisted creation of visualizations, click Use assisted explore to use Insight Advisor. See: Creating visualizations with Insight Advisor
-
Click Properties to open the properties panel. Configure the properties for a sheet or visualization. For example, you can add dimensions and measures to a visualization. See: Properties panel
Analyze
Interact with visualizations and data in a sheet.
Sheet view in analyze mode
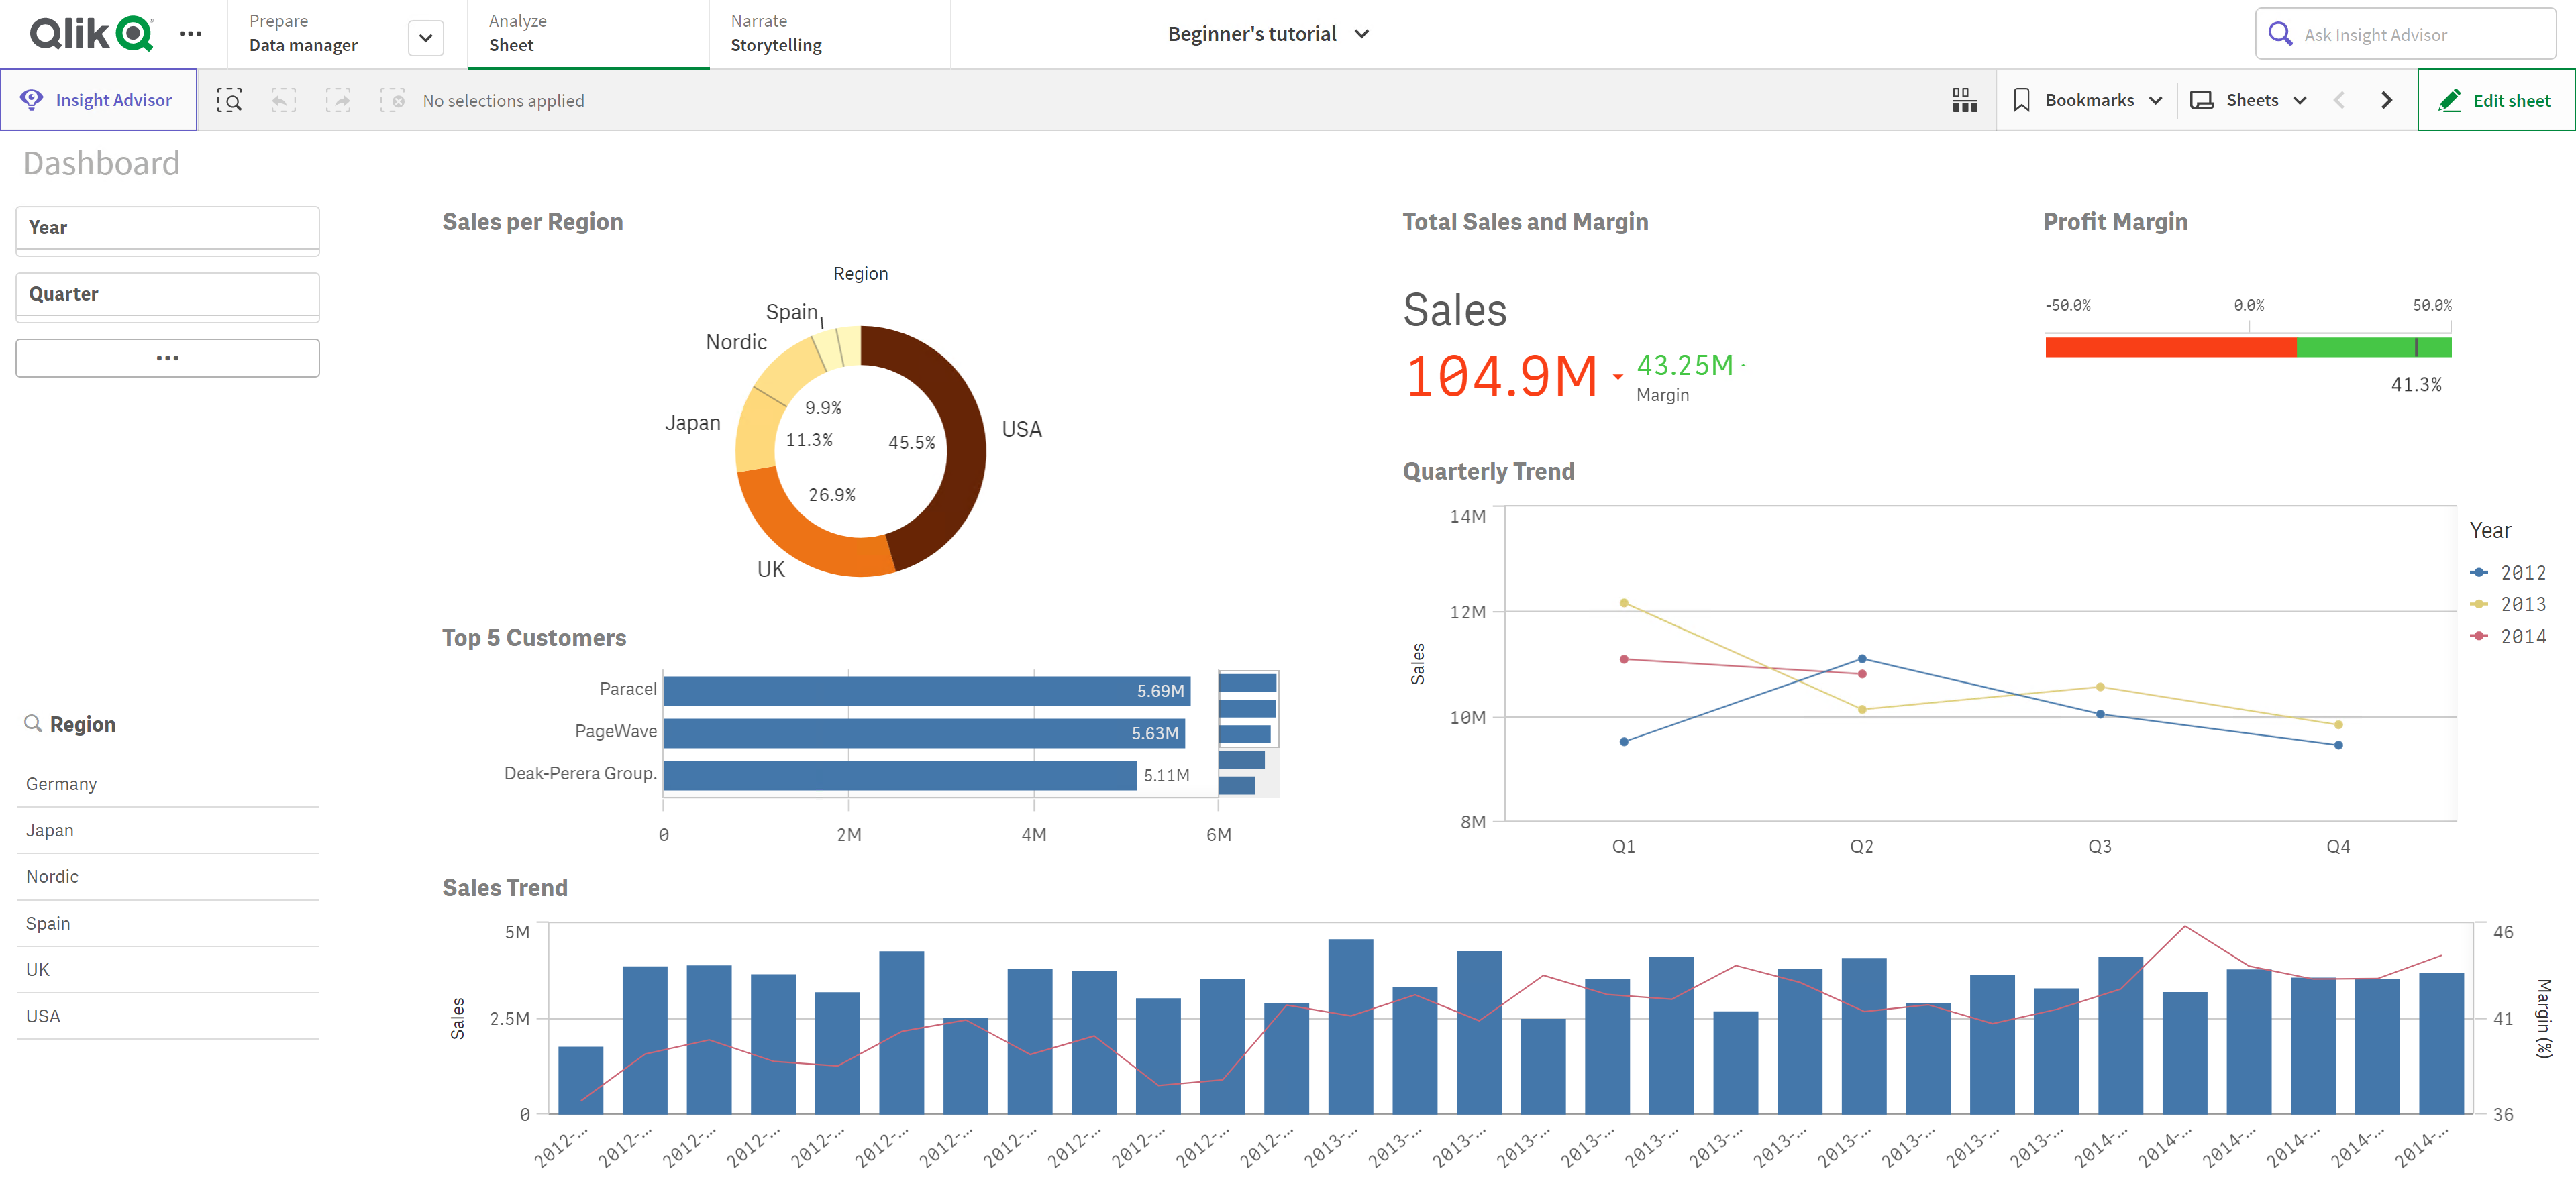
You can do the following:
-
Click Sheets to navigate to a sheet.
-
Make selections in a visualization to explore insights based on selections. See: Exploring with selections
-
Create bookmarks based on selections. See: Bookmarking selections
-
Search your data. See: Using smart search
| User interface item | Action |
|---|---|
|
|
Step back in selections. |
|
|
Step forward in selections. |
|
|
Clear all selections. |
|
|
Open smart search to search in the entire data set. For more information, see: Using smart search |
|
|
Open the selections tool, which is an extension of the selections bar. |
Options menu
With the options menu, you can take a snapshot of your chart, change certain chart properties in the exploration menu, or view your chart in full screen mode.
Options menu next to a chart
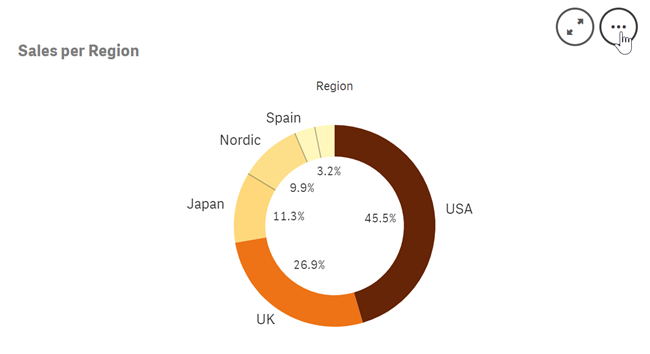
You can open the options menu by:
- Right-clicking on a chart.
- Clicking the hover menu
.
Menu options will be different depending on:
- Whether you are editing or analyzing (viewing) charts in an app.
- The chart type.
- The privileges that have been assigned to you by your administrator.
Options menu for a chart with hover menu expanded
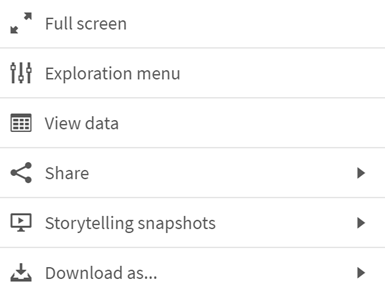
The menu looks different if you have touch screen mode enabled on a supported device. You can toggle touch support on and off by clicking or tapping the navigation button () and using the toggle for
.
Options
-
Full screen: Expand visualization to full-screen mode.
-
Exploration menu: Change certain visualization properties, without making selections or editing the sheet. See: Visual exploration
-
View data: View the data for a visualization in a table.
-
Share: Share the visualization in different ways, for example as an image, a link, or an embedded object.
-
Create alert: Create an alert for the data in the visualization.
-
Take snapshot or open Snaphot library. See: Collecting insights for stories using snapshots
-
Download: Download the visualization in different formats, such as an image or a data file.
Insight Advisor
Click Insight Advisor to access Insight Advisor Search and Insight Advisor Analysis Types. You can ask a question in the Insights search field to generate visualizations with Insight Advisor Search.
Insight Advisor
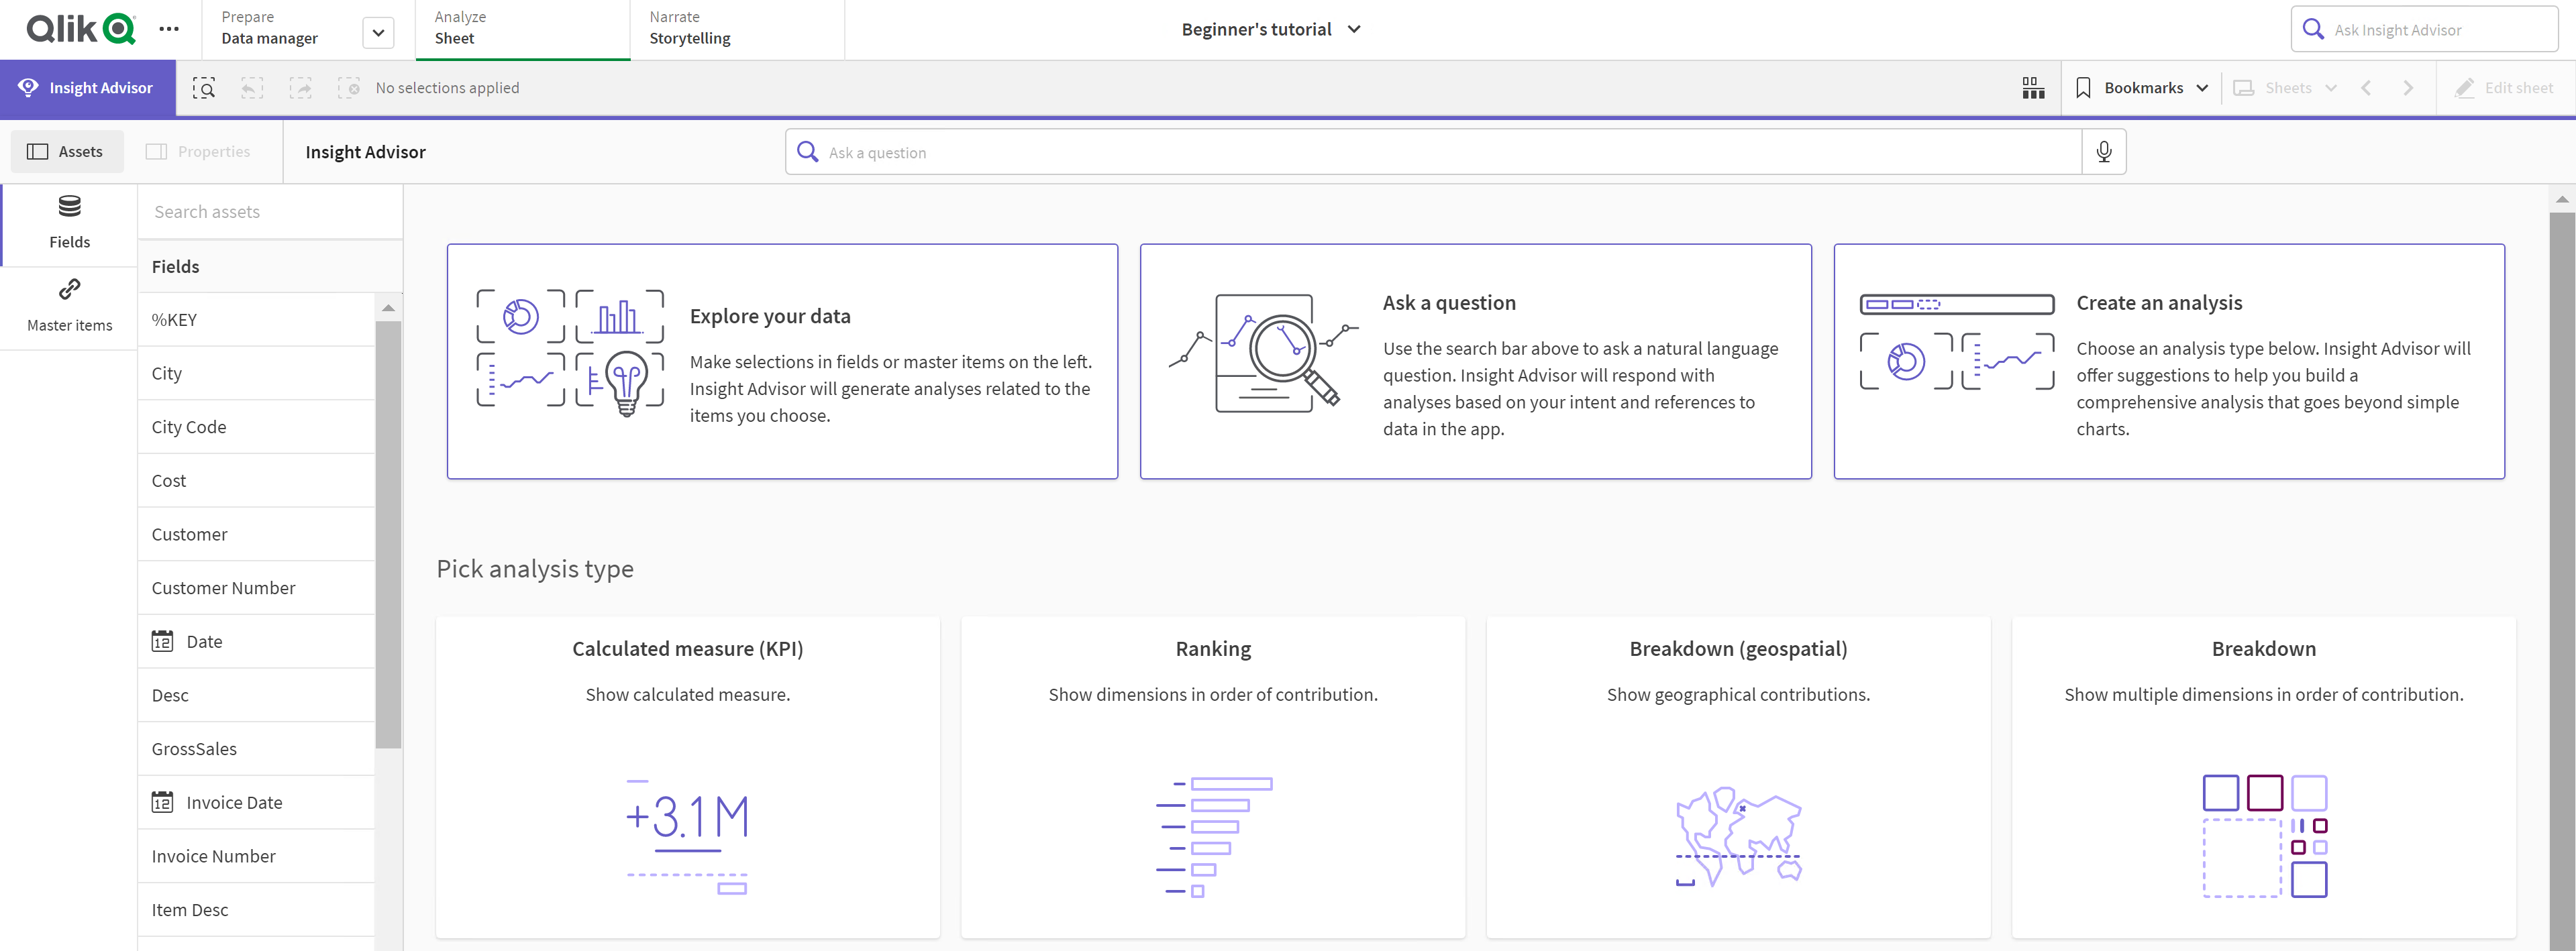
For more information, see Creating visualizations with Insight Advisor.
Touch gestures in sheet view
| Touch gesture | Action |
|---|---|
| Long-touch and release | Open the shortcut menu |
| Long-touch a visualization | Open the options menu |
| Swipe | Scroll lists and visualizations |
| Pinch | Zoom in or out on visualizations |
| Two-finger tap | Select an interval in a list, table or bar chart axis |
| Two-finger swipe | Pan a scatter plot visualization |
| Three-finger tap | Reset the zoom level of a scatter plot visualization |
