Transforming data types
When you train a machine learning model, it is important that the dataset accurately represents all data types. If a variable has an inaccurate representation, it could lead to a model with low accuracy or a model that looks good but doesn’t predict well when applied to real world data. You need to be able to discern what each feature measures and how to assign a proper representation for that feature.
In general, machine learning would consider anything that is a float or double data type to be a numerical value, and anything that is a string to be categorical. That might, however, not always be the correct interpretation, as we will see in the following examples.
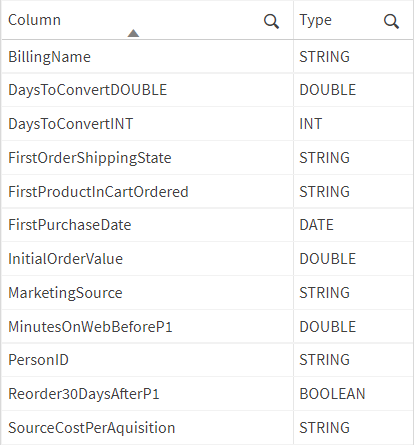
The examples are based on a dataset that has been aggregated to answer the question: "Will a user repurchase any product within 30 days of the first purchase date?" The dataset contains columns of different data types, such as string, double, integer, boolean, and date.
Columns and data types
Strings
The table below shows two of the columns in our dataset that both have the data type string. The column MarketingSource doesn't have a measurable difference between the values, for example, between "Facebook" and "Customer Referral". There is no numerical or scalar relationship and the column should therefore be considered categorical.
On the other hand, the values of the column SourceCostPerAcquisition range from "Low" to "High" and have a more measurable difference between them. It’s not as exact as having the average cost per source acquisition in dollars, but there is a distinct order of magnitude between the values. In this case, it could be discussed whether SourceCostPerAcquisition should be considered categorical or numerical.
Sample data for the columns PersonID, MarketingSource, and SourceCostPerAquisition
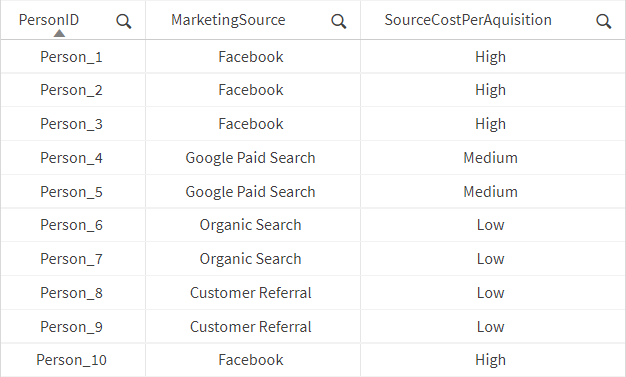
A recommended practice in these situations is to create two separate configurations, each with a different possible classification of the features. These experiments would be run separately. The first configuration would be for the original string representation. In the second configuration, you would give a numerical mapping to the different values, converting the column to the data type double. For example, "Low" = 1.0, "Medium" = 2.0, and "High" = 3.0. After running each configuration, you could gain more understanding of which configuration works better for that particular use case. In some cases, it makes sense to use a string representation, and in others, a numerical representation might make more sense.
Numbers
When there is a measurable difference of what the data in a column describes, it should be represented as numerical values. Examples of this are cost, revenue, profit, counts, sums, and averages.
Sometimes the dataset might have a numerical value that isn’t measurable because it is a dictionary or incremental value like an ID. In our example, the values in the column PersonID might have been mistaken for a numerical value if they hadn't started with "Person_". Treating the IDs as numerical values would have been an inaccurate representation of the difference between those rows. The best practice in such cases is to represent the ID as a string. Before you use a dataset, you might need to determine if any of the numerical columns should be converted to categorical values.
Dates
In the context of machine learning, date field types are categorical variables. Although dates and timestamps can be subtracted from one another, there are several components to a date. The question is which of those components to consider and how: Should the value be the year, month, day of the month or year, or the hour of the day? Maybe you want the time difference in minutes? To get the most predictive power, the date should be parsed into at least a few of its components. Some of those components could be categorical and some could be numerical.
For example, a date can be parsed into the day of the week. This could be represented as a numerical value (1 to 7) or a string value ("Sunday" to "Saturday").
Weekdays as numbers and strings
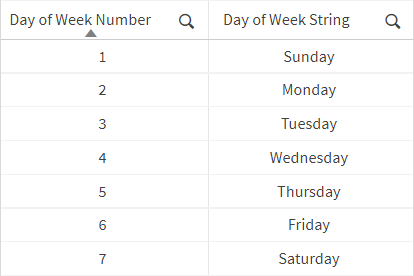
There are a few issues with representing the day of the week as a numerical value. When is the start of the week, is it Monday or Sunday? Also, even if the day of the week is important, it might be hidden in a cyclical trend.
In some instances, the trend might be very telling as in Chart 1 where the week starts on the Monday.
Chart 1: Average sales per weekday where the week starts on Monday
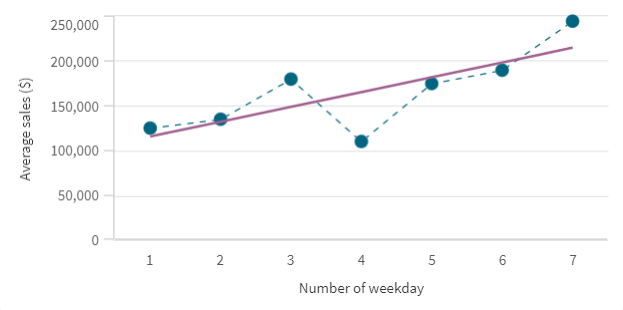
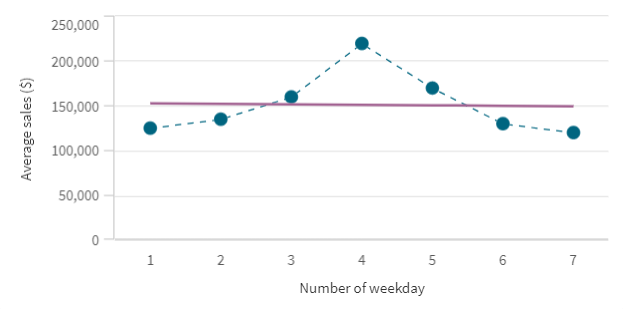
Chart 2 has the same data as Chart 1 but has been shifted one day so that the week starts on the Sunday. Here the significance of the data is much lower.
Chart 2: Average sales per weekday where the week starts on Sunday
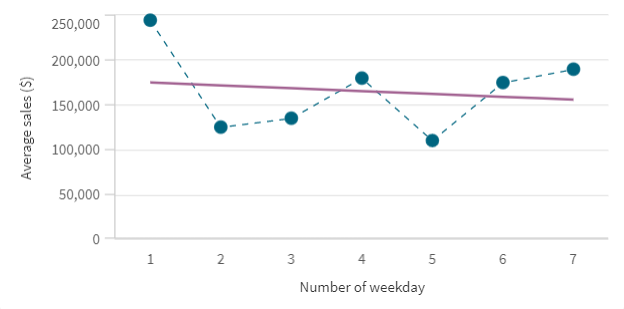
Chart 3 illustrates another problem with using the parsed component of a date as a numerical value. There might be a significant pattern present, but if it is not linear, it will be missed. Because of this, and the cyclical trends (for example, daily or quarterly seasonality) that are often present in date components, it is recommended to use these components as categorical values and not as numerical values.
Chart 3: Average sales per weekday showing a midweek high
Qlik AutoML uses automatic feature engineering to separate the components of dates and timestamps into their own distinct columns. This helps to improve the predictive capability of the models you create. Auto-engineered features that have been derived from a parent date feature are classified as numeric features. If needed, you can override this functionality so that date columns are treated as categorical. For more information, see Date feature engineering.
Date differences
Date differences can be used as a better substitute to incremental IDs because an incremental ID is only descriptive of the order that records were added to the table. Incremental IDs can easily be skewed by the change in volume (customers per day in many examples), whereas a date difference is agnostic of that velocity.
The date difference could be one of several measures—seconds, hours, days, months, or quarters. Pick the one that is the most relevant to the granularity of the data that you have. For example, when looking at monthly data, there will not be any real value in a date difference of days. In that case, a date difference of months would be more relevant.
