Histogram Chart
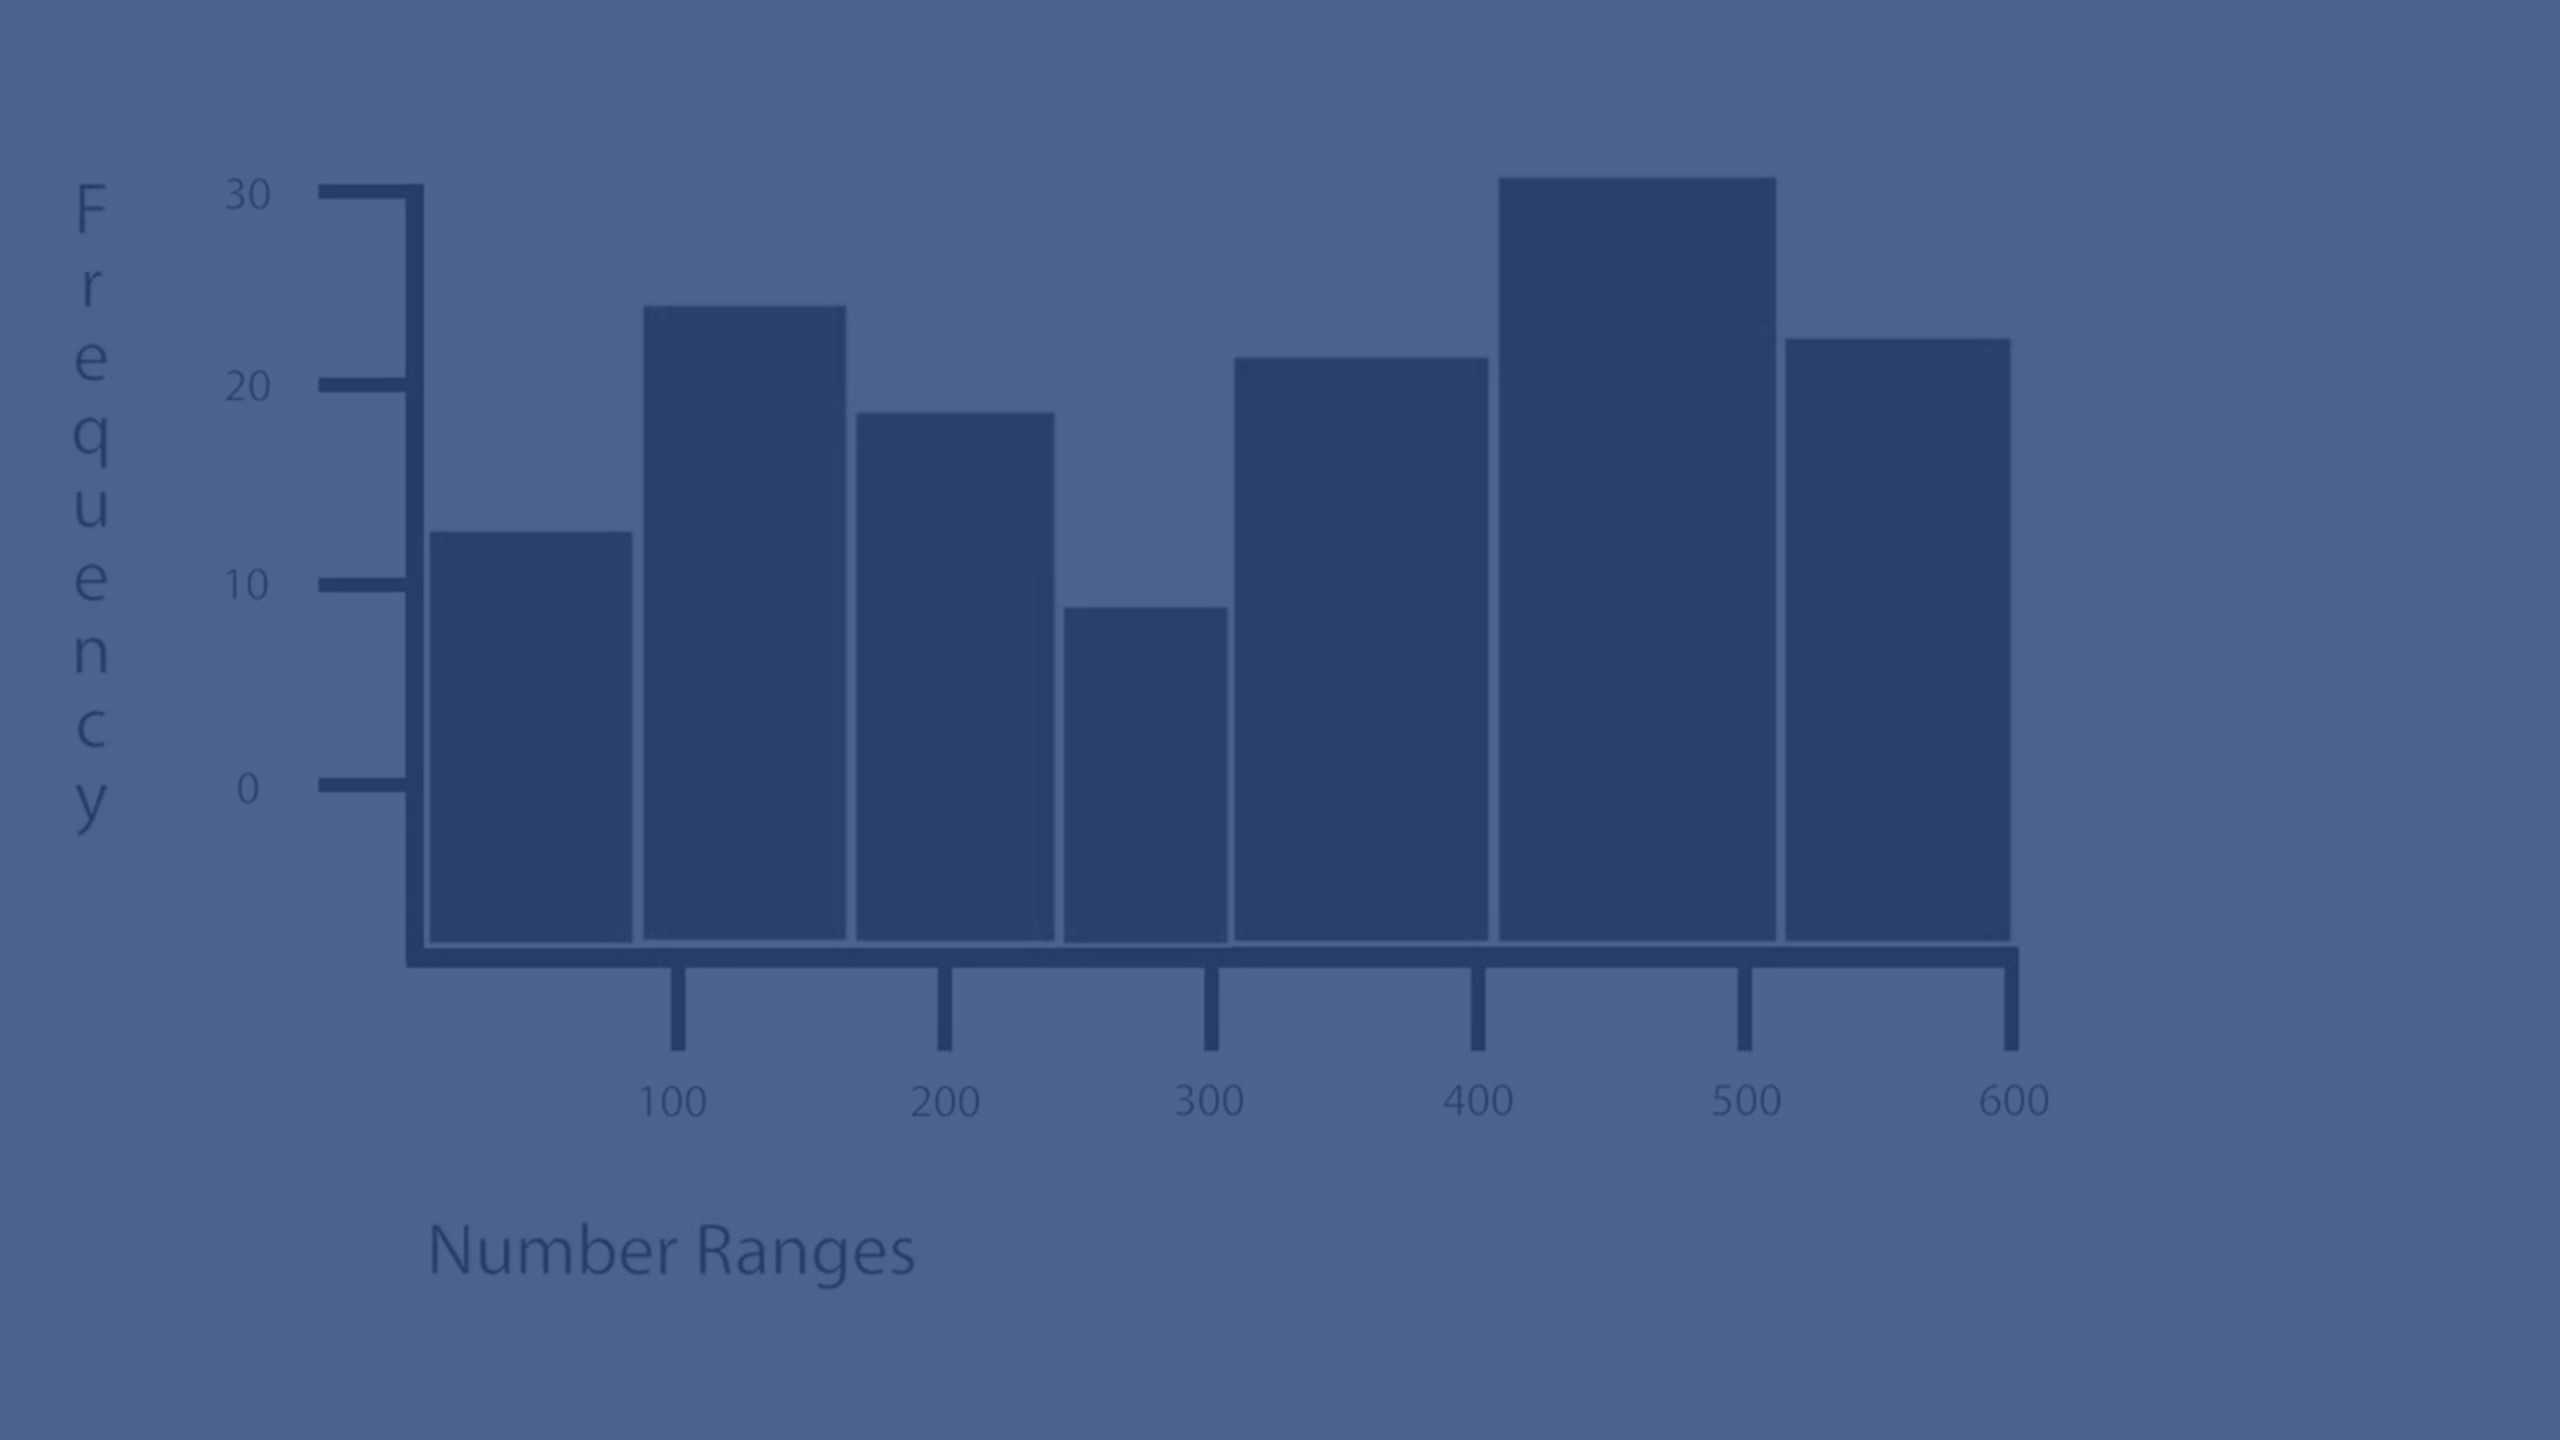
Learn how to create and customize a histogram in Qlik Sense to display the distribution of numerical data over a continuous interval. This tutorial covers setting up bins, adjusting bar width, adding reference lines, and refining chart appearance for clear and effective data visualization. Ideal for analyzing time ranges, income data, and other continuous numerical fields.
Chapters:
📊 00:00 – Introduction to Histograms
🔄 00:00:35 – When to use a histogram
🎨 00:01:12 – Customizing histogram appearance
📏 00:01:20 – Adjusting bar width and number of bins
🧮 00:01:25 – Using calculated conditions and reference lines
📌 00:01:30 – Adding min and max reference lines
🎛️ 00:01:45 – Further appearance adjustments
🚫 00:01:50 – Hiding grid lines
🌈 00:01:55 – Changing bar colors
✅ 00:02:04 – Final histogram ready
To learn more about Qlik Sense visit the http://help.qlik.com/