Navigate sheets and bookmarks and add assets to your sheet or visualization using the assets panel.
Click Show assets in the lower left corner of a sheet to open the assets panel.
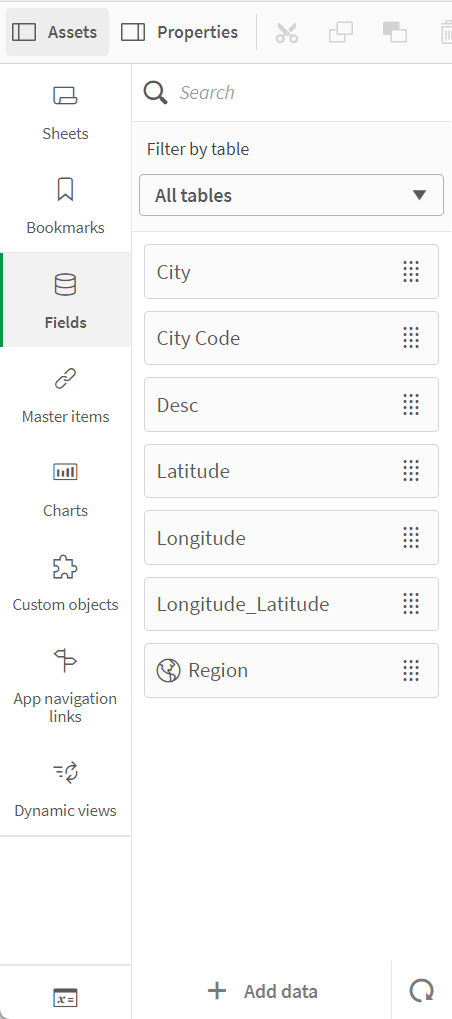
Assets panel in edit mode with Fields selected

All assets may not be available, depending on your Qlik Sense configuration.
Assets panel in edit mode
The assets panel in edit mode contains the following:
-
Sheets: View and edit sheets in the app.
-
Bookmarks: View and edit bookmarks in the app.
-
Fields: Add data to visualizations from available fields.
-
Master items: Add data to visualizations from available master items.
-
Charts: Add visualizations to the sheet.
-
Custom objects: Add custom objects to the sheet.
Creazione di una visualizzazione mediante un oggetto personalizzato
-
App navigation links: Add links to build on-demand apps.
-
Dynamic views: Connect a base app to a template app to use master visualizations from that app as dynamic charts in your sheets.
Fields
Fields represent the data that is available in your app. Drag a field onto a sheet to create visualizations with chart suggestions. Drag a field onto a visualization to add the field to a visualization.
Additionally, right-click on fields to do the following:
-
Create a new master dimension. See: Creazione di una dimensione principale da un campo
-
Create a new master measure. See: Creazione di una misura principale da un campo
-
Create a calendar measure. See: Creazione di misure di calendario
-
View field settings. See: Sempre un valore selezionato
Date and time
All date fields are marked with and can be expanded to use date and time attributes of the field. Date and time attributes are created automatically when you use the Data manager. If you used the data load script to load data, you need to create the date and time attributes using derived fields.
See: Campi data e ora
Map data
All fields recognized as geopoints in map visualizations are marked with .
See: Caricamento dei dati utente per la mappa
Master items
Create dimensions, measures, and visualizations as master items that can be re-used in your app.
See:
Charts
Drag charts onto your sheet to create visualizations.
See: Visualizzazioni
Custom objects
Enhance your apps with custom-designed visualizations.
See: Creazione di una visualizzazione mediante un oggetto personalizzato
App navigation links
Build on-demand apps using app navigation links. On-demand apps load a subset of the data that is loaded in aggregate form by a selection app.
See: Creazione di un'app on-demand
Dynamic views
Create dynamic views to query and view relevant subsets of large data sets in charts that can be dynamically refreshed as selections are made.
See: Gestione dei dati con viste dinamiche
Variables
Click to open the variables dialog.
See: Finestra di dialogo Variabili
Search
Trovare le risorse mediante il campo di ricerca. Quando si inizia a digitare nel campo di ricerca, vengono visualizzate le voci che con un nome o un tag contenente la stringa di ricerca.
See: Ricerca nel pannello risorse
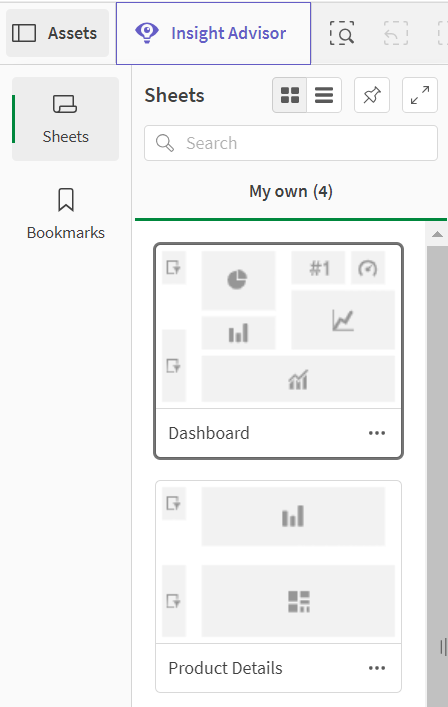
Assets panel in analysis mode
In analysis mode, click Assets to open a panel where you can create and manage the following:
-
Sheets: View and navigate sheets in the app. Create and group sheets.
-
Bookmarks: View and navigate bookmarks in the app. Create new bookmarks.
Memorizzazione di selezioni nei preferitiMemorizzazione di selezioni nei preferiti
To pin the assets panel open in analysis mode, click . The assets panel can be resized by clicking and dragging the border of the assets panel.
You can make Sheets or Bookmarks full screen by clicking .
You can view Sheets as a grid or list. Sheets can also be grouped together. For more information, see Raggruppamento di fogli.
Assets panel in analysis mode

