
You can add a filter pane to control what data that is shown in the visualizations on a sheet. A filter pane can filter the data of several dimensions at once.
For example, if you have a chart of sales over time, you can use a filter pane to limit the data in the chart to only show sales from a selected time period, from certain product categories, and from a certain region.
When a dimension is added, it is placed to the right of the previous dimensions, or below, depending on the available space. As long as there is enough space, the dimensions are displayed as expanded lists. If there is not enough space, the dimensions that were added first are turned into filter panes.
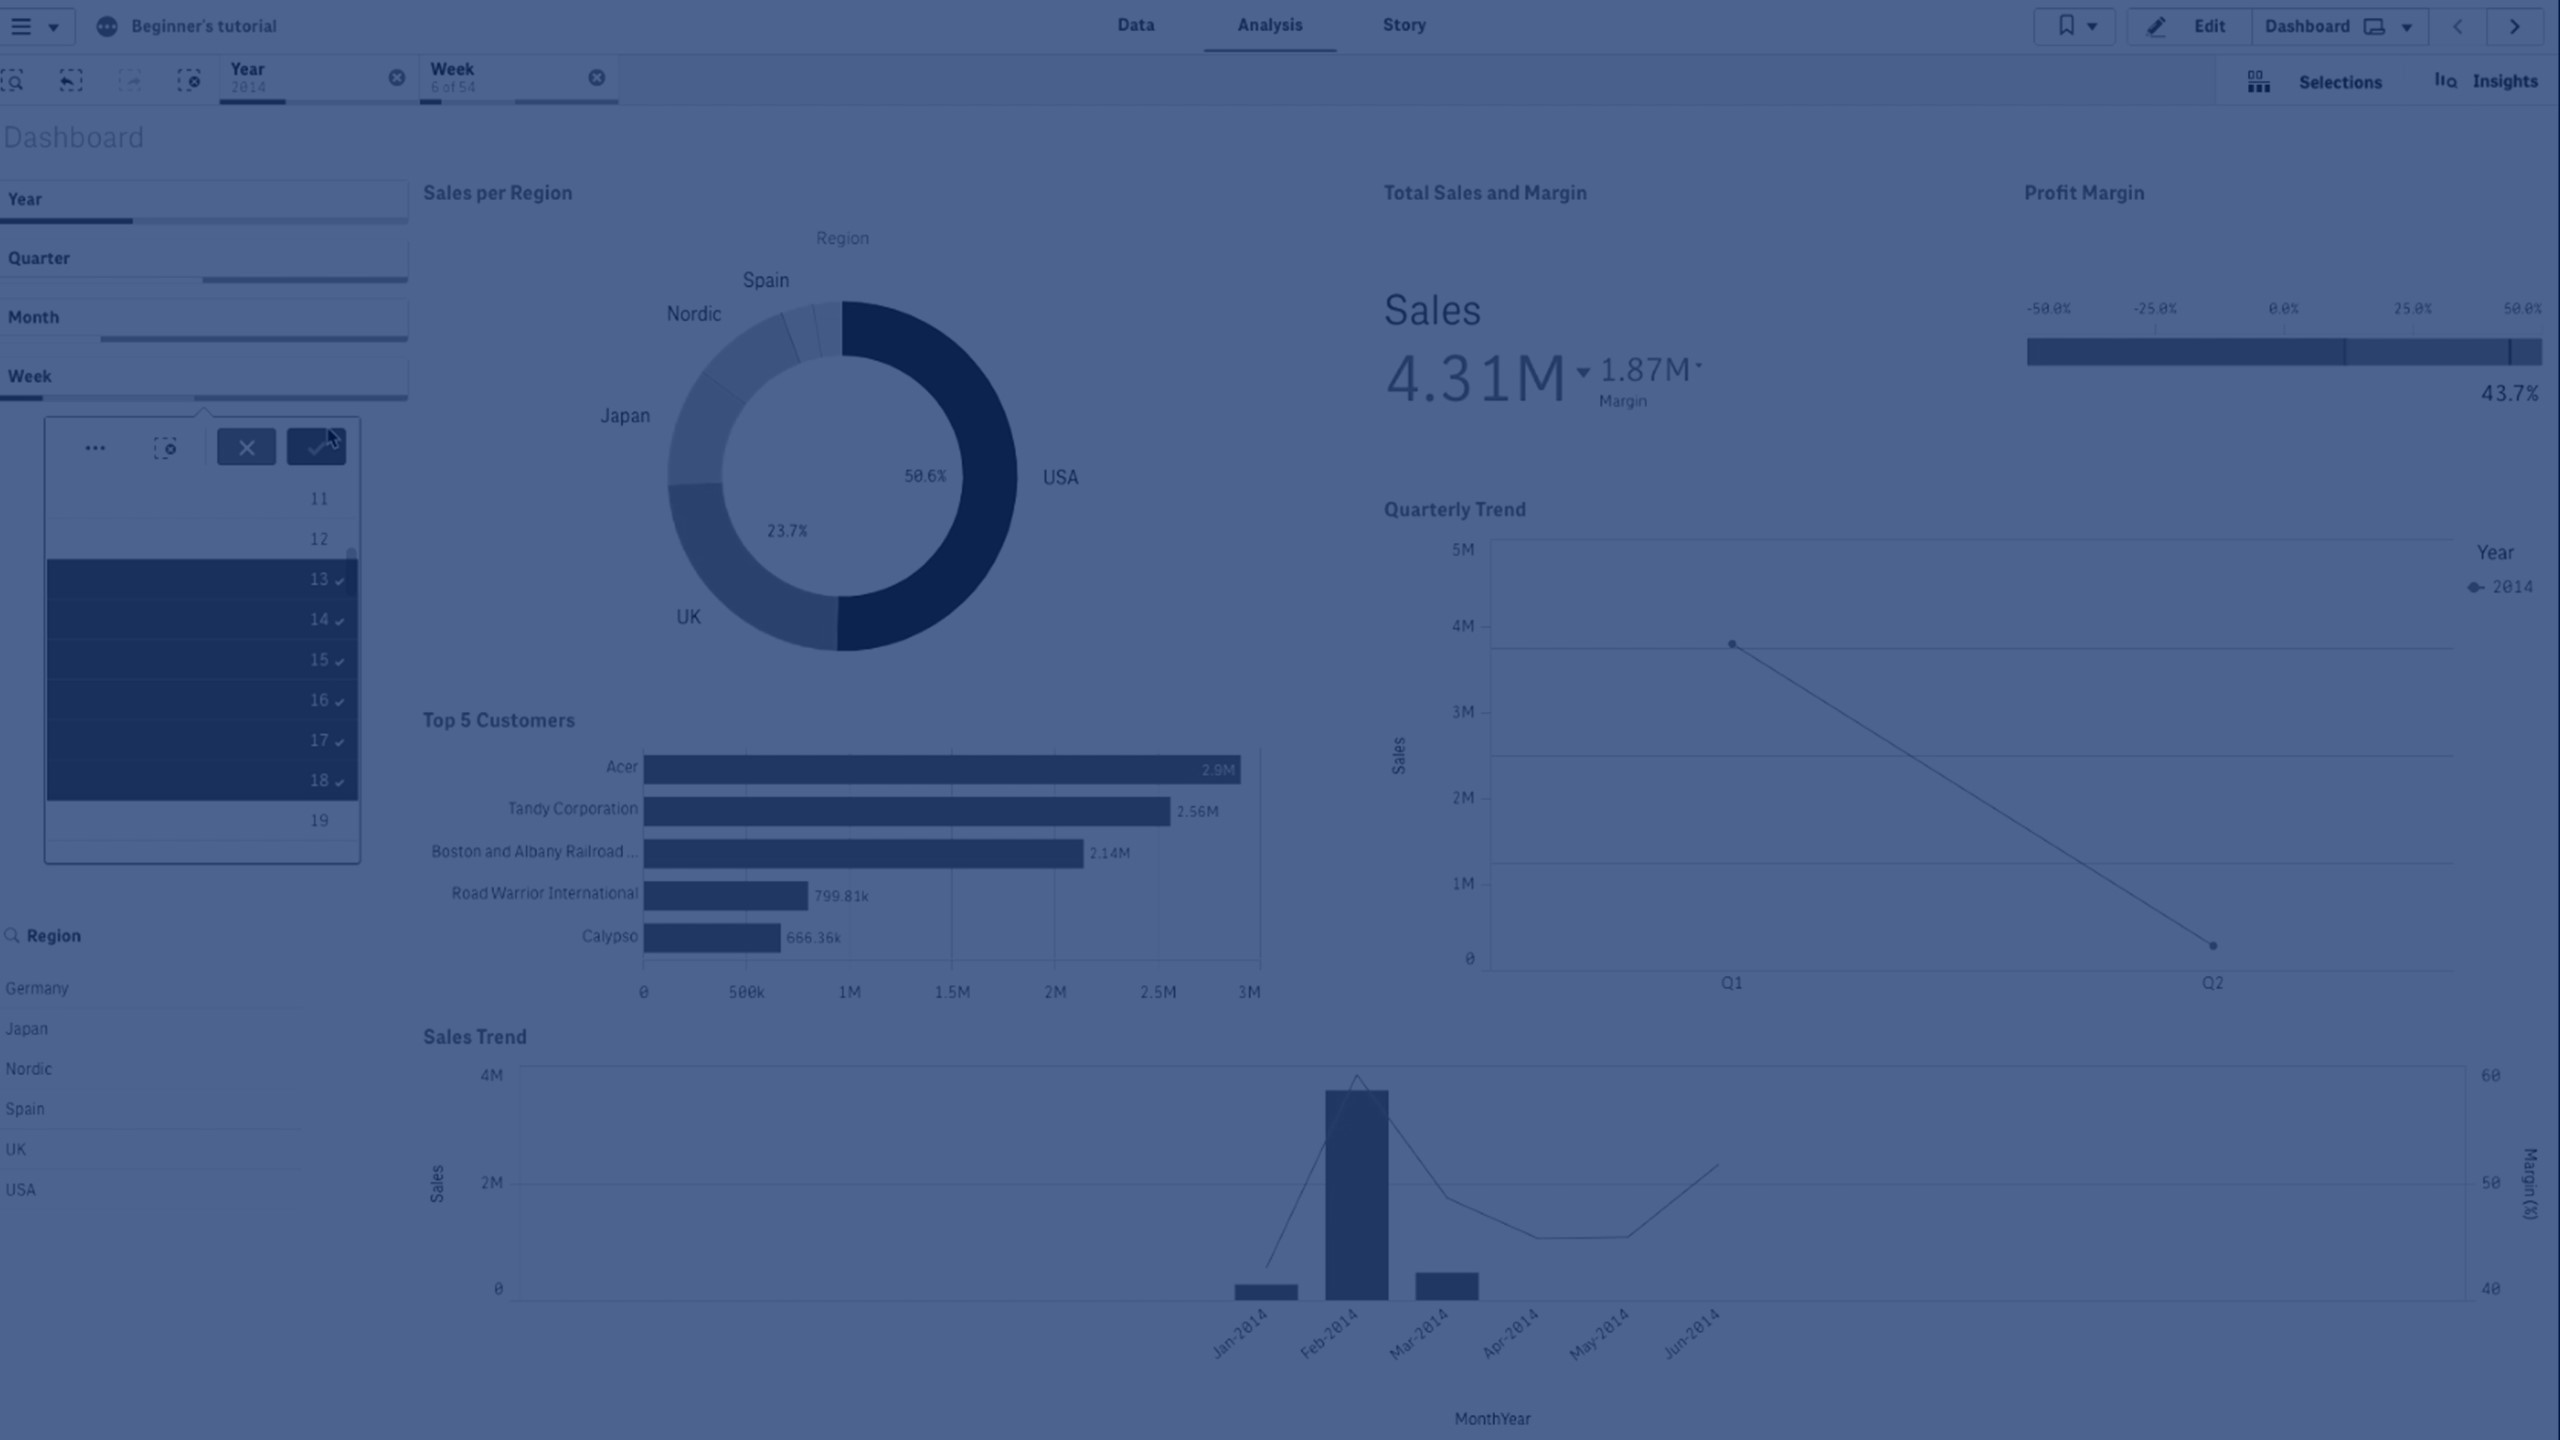
Selections have been made in the dimensions Year, Quarter, and Week.

When to use it
With filter panes, you can easily make several selections to define your data set exactly like you want it. With your well-defined data set, you can explore data of particular interest.
By using the selection menu options in the filter panes (select possible, select alternative, and select excluded), you can make adjustments to the data set and compare the results with the previous selection.
Advantages
Filter panes are good for making selections and defining data sets. But they also show the relationship between different values, the associations. The green, white, and gray colors reflect the data associations that exist - and that do not exist. And by analyzing those associations, you can make new discoveries, for example, that a sales representative has too many customers, or that a region lacks a sales representative.
Disadvantages
When the dimensions contain a very large amount of values, it may be hard to manage the data.
Creating a filter pane
You can create a filter pane on the sheet you are editing.
In a filter pane you can use up to 1000 dimensions.
Do the following:
- From the assets panel, drag an empty filter pane to the sheet.
- Click Add dimension and select a dimension or a field.
- If you want to add more dimensions, click Add dimension again.
When you have created the filter pane, you may want to adjust its appearance and other settings in the properties panel.
Configuring filter panes
In the properties panel, you can customize the look and feel of the filter pane. Listboxes for each dimension can be customized individually.
Selections in filter panes
During analysis you click a compressed filter pane dimension to open a selection list.
When you make a selection, it is reflected in the small bars at the bottom of each filter pane dimension. Four states can be displayed in the bars: selected (green), possible (white), alternative (light gray), and excluded (dark gray). Locked values are indicated by a lock icon. The details of the selections are displayed in the selections bar, above the sheet. You can click an item to see the details and change your selection.
Fields are filtered out from each dimension to be shown in the visualizations on the sheet.
Making selections in filter pane lists
When there is space enough in a filter pane, the dimension values are displayed in a list. In lists, you can click to select a single value or draw to select several values. On a touch device, you can two-finger-tap in the list to select a range of values.
Germany, Japan, and Nordic selected in the Region filter pane.

The selections tool
The selections tool offers an option to get an overview of the fields and dimensions in an app. In the selections tool you can make selections in all the fields and dimensions in the app, regardless of whether they are used in the app or not.
During analysis, click Selections to open selections view.
Display limitations
Responsive design
The filter pane has a responsive design and renders as many dimensions as possible. When space is limited, this could involve reducing the size of each dimension so that all dimensions are displayed.
Example:
The following image shows a filter pane while it is being edited. Only three out of five dimensions are displayed. The other dimensions are represented by a dropdown list with a numeric value indicating how many dimensions are not displayed.
Filter pane in edit mode.

When you have finished editing the filter pane and enter analysis mode, you will see the filter pane with all the dimensions displayed. If all items cannot be shown due to lack of space, the dropdown list below the displayed dimensions can be expanded to show additional dimensions.
Filter pane in analysis mode, with expanded dropdown list showing additional dimensions.

Full screen view
In full screen view, the filter pane is maximized and displays as many dimensions as possible expanded. When not all dimensions can be displayed expanded, the priority order is that the most recently added dimensions are expanded to the right. You can change the priority order in the properties panel, under Dimensions. Drag the dimensions to change the order.
Keyboard navigation
You can use your keyboard to navigate a filter pane. Use the arrow keys or the Tab key to alternate between the different objects on the sheet. Once you have moved the focus to the filter pane, use the Enter, Space and Esc keys to move the focus between the following levels:
-
Entire filter pane
-
Listboxes inside the filter pane
-
Values inside each listbox
|
Keyboard navigation |
Description |
|---|---|
| Space or Enter |
Moves focus to the first listbox in the filter pane. Another key press brings the focus to the first value inside that listbox. If the focus is on a collapsed listbox, press Enter to open the listbox in a pop-over. |
| Esc | Moves focus back one level (from the values to the listbox to the filter pane object). |
|
Right arrow |
If the focus is on an individual listbox within the filter pane, the right arrow key moves the focus to the next listbox on the right. If the focus is on a value inside a listbox, the right arrow key moves to the next value in the listbox. |
| Left arrow |
If the focus is on an individual listbox within the filter pane, the left arrow key moves the focus to the next listbox on the left. If the focus is on a value inside a listbox, the left arrow keymoves to the previous value in the listbox. |
| Up arrow |
If the focus is on an individual listbox within the filter pane, the up arrow key moves the focus to the previous listbox (to the left, or above, the current listbox). If the focus is on a value inside a listbox, the up arrow key moves to the previous value in the listbox. |
| Down arrow |
If the focus is on an individual listbox within the filter pane, the down arrow key moves the focus to the next listbox (to the right, or below, the current listbox). If the focus is on a value inside a listbox, the down arrow key moves to the next value in the listbox. |
For more information about keyboard navigation, see Keyboard navigation and shortcuts.