
Container
The container is an object that lets you add visualizations in a limited space. You can also show or hide the visualizations inside the container based on conditions.

When to use it
The container is useful when you want to quickly switch between different visualizations on a dashboard with limited space. You can also use a container to show different visualizations based on:
- Which user is accessing the chart.
- The value of a variable.
-
The possible number of values in a field, by using the GetPossibleCount() function in the condition expression.
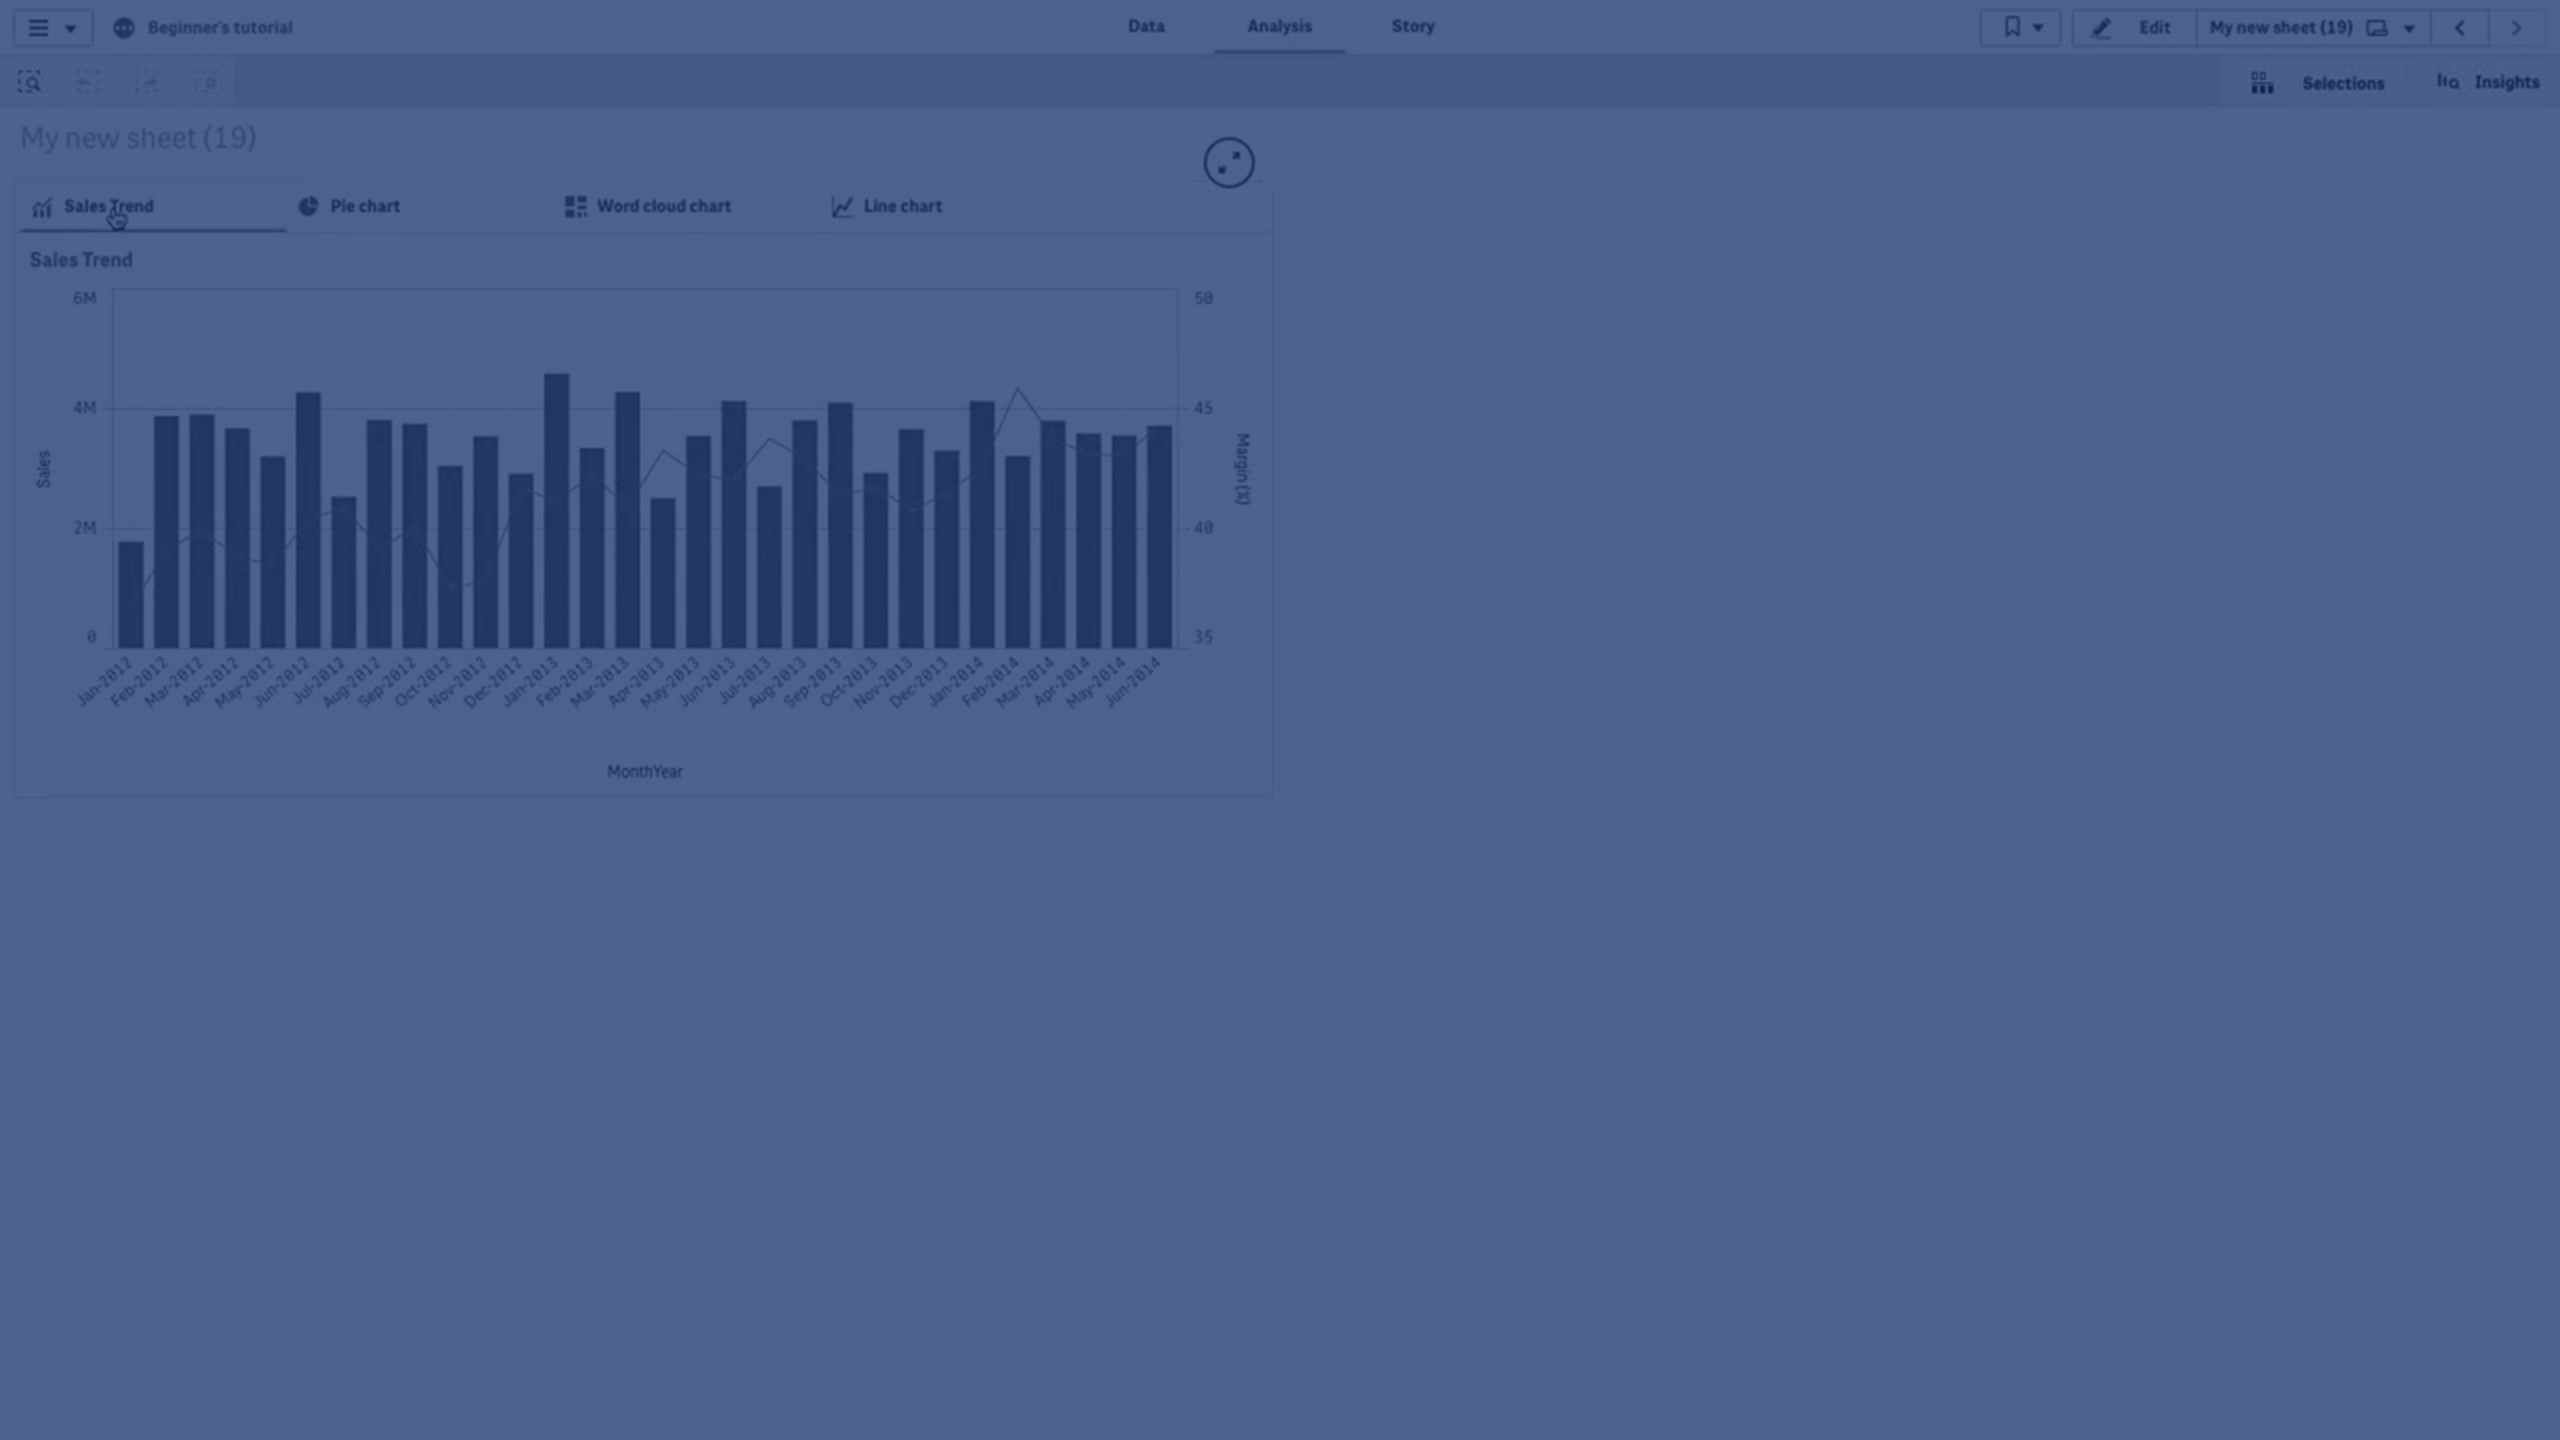
Displaying different charts based on selections with a container
Creating a container
You can create a container on the sheet you are editing.
Do the following:
- From the assets panel, drag a Container object to the sheet.
- Click Add under Content in the properties panel.
-
Select a master visualization in Master items, or create a new visualization in Charts.
Alternatively: you can add content to your container by dragging available visualizations from your sheet, or from your Master items, directly on the container.
- Drag the charts in the property panel to set the tab order.
You now have a container with a tab for each visualization you added. You can switch between tabs to show different visualizations.
Adding show conditions
You can add show conditions on the tabs you have created.
Do the following:
- Click on the chart you want to add a show condition to, under Content in the property panel.
-
Add a show condition for the chart in Show condition. Typically you would use an If() function.
-
Add another show condition to a different chart.
The charts will now be shown or hidden depending on the result of the conditions you added. If the condition of a chart results in True, it is shown, and if it is False, it is hidden.
Changing the default active tab
By default, the first tab is displayed when you view a container. You can change this in the property panel.
Do the following:
-
Go to Appearance > Container in the property panel.
-
Use the Default tab dropdown to select which chart displays when users view a sheet. The dropdown lists the available charts in the same order they are arranged in the container.
-
If you want to see the new default tab setting take effect, close and re-open your browser.
Creating a bookmark with a container object
By default, if you create a bookmark that contains a container object with selections, the first tab will be active when the bookmark is selected. To save a different default active tab for the container, you can toggle on Save layout when creating the bookmark with that tab open. If you set that bookmark as the default bookmark by right-clicking and selecting Set as default bookmark in the bookmark list, the sheet will open to the selections and tab that were active when the bookmark was created.
Do the following:
-
Click
 in the toolbar.
 -
Click Create new bookmark.
Change the name and description, if desired.
- If you want a tab other than the default tab to be the active tab, toggle on Save layout with that tab open. This will override the Default tab setting in the property panel.
- Click Save.
Display limitations
- You cannot use a master visualization that has a container inside another container.
- You cannot add the same master visualization twice in a container.
- You cannot create a chart inside a container by dropping measures or dimensions on the container.