
Configure properties for a sheet or visualization in the properties panel.
Click Show properties in the lower left corner of a sheet to open the properties panel. You have to be in edit mode.
Click on the sheet to view the properties for the sheet. Click on a visualization to view the properties for the visualization.
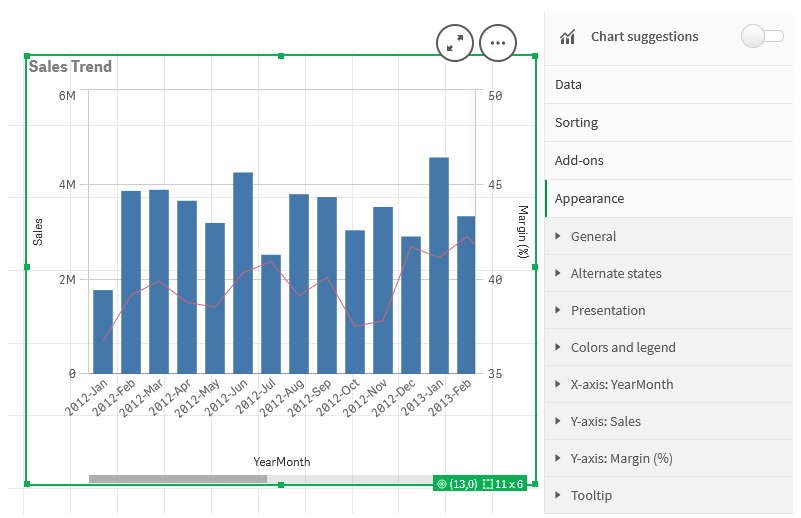
Properties panel with a visualization selected
For sheets, you can:
- Edit sheet title and description
- Add a thumbnail for a sheet
- Change the grid spacing, sheet size, and layout
- Apply alternate states to the sheet
- Add actions triggered when users navigate to the sheet
Depending on the visualization that you are editing, you have different options. Typically, you can do the following:
- Add dimensions and measures and specify how they are displayed
- Set the sorting order and sorting criteria
- Change the way the visualization appears
- Configure custom tooltips
See: Creating and editing visualizations