Funnel Chart
Learn how to create and customize a Funnel Chart in Qlik Sense. This tutorial guides you through adding dimensions and measures, adjusting chart modes, coloring segments, and effectively visualizing processes that decrease across stages. Perfect for sales, marketing, and analytics teams aiming to track conversions, orders, or visitor trends.
📊 00:00 – Introduction to Funnel Chart
🔄 00:00:08 – What is a Funnel Chart?
📈 00:00:16 – Understanding stages and subsets
💼 00:00:47 – Using funnel charts for sales stages
🛠️ 00:01:17 – Creating a funnel chart in Qlik Sense
🎨 00:01:37 – Customizing chart appearance
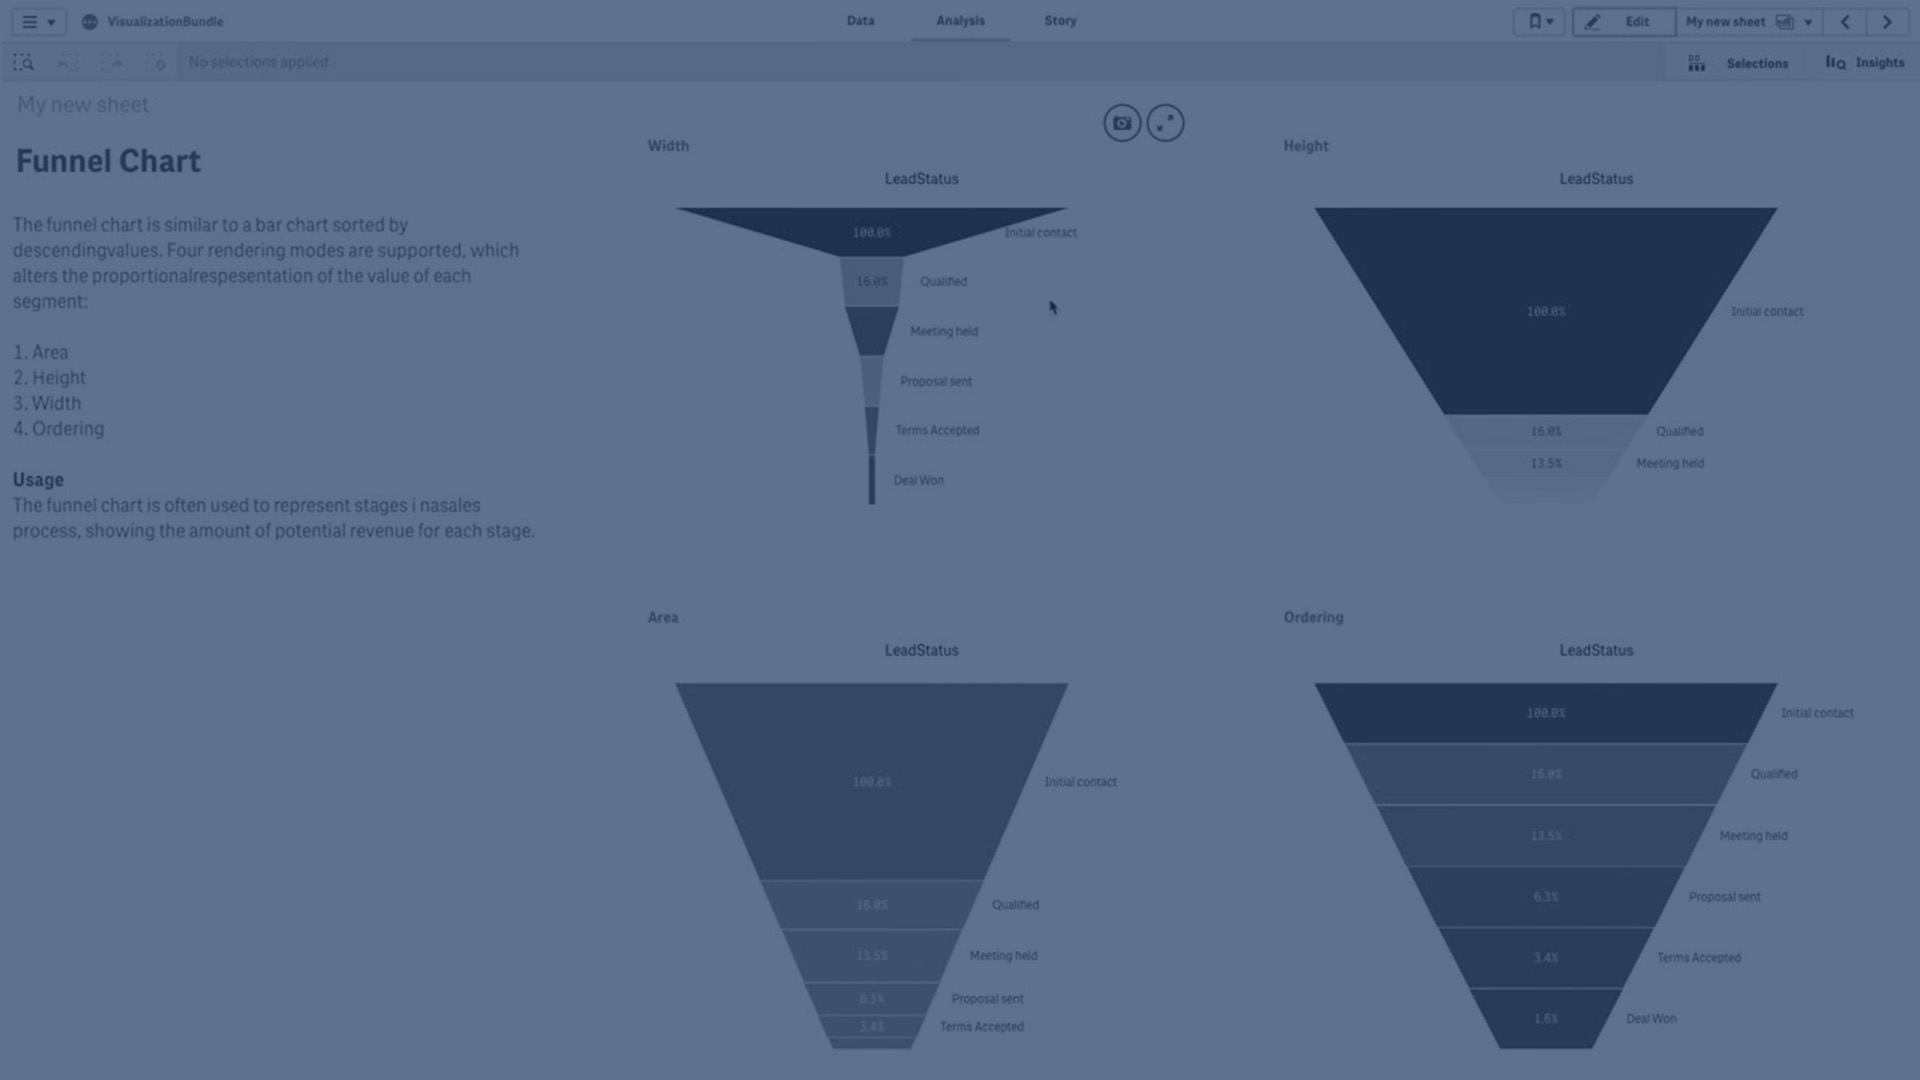
🖼️ 00:02:09 – Presenting data with funnel modes
🌈 00:02:47 – Coloring by measure in area mode
🎨 00:02:56 – Diverging classes and reverse color
🌈 00:03:12 – Diverging gradient without reverse color
✅ 00:03:19 – Ordered funnel segments