Line Chart
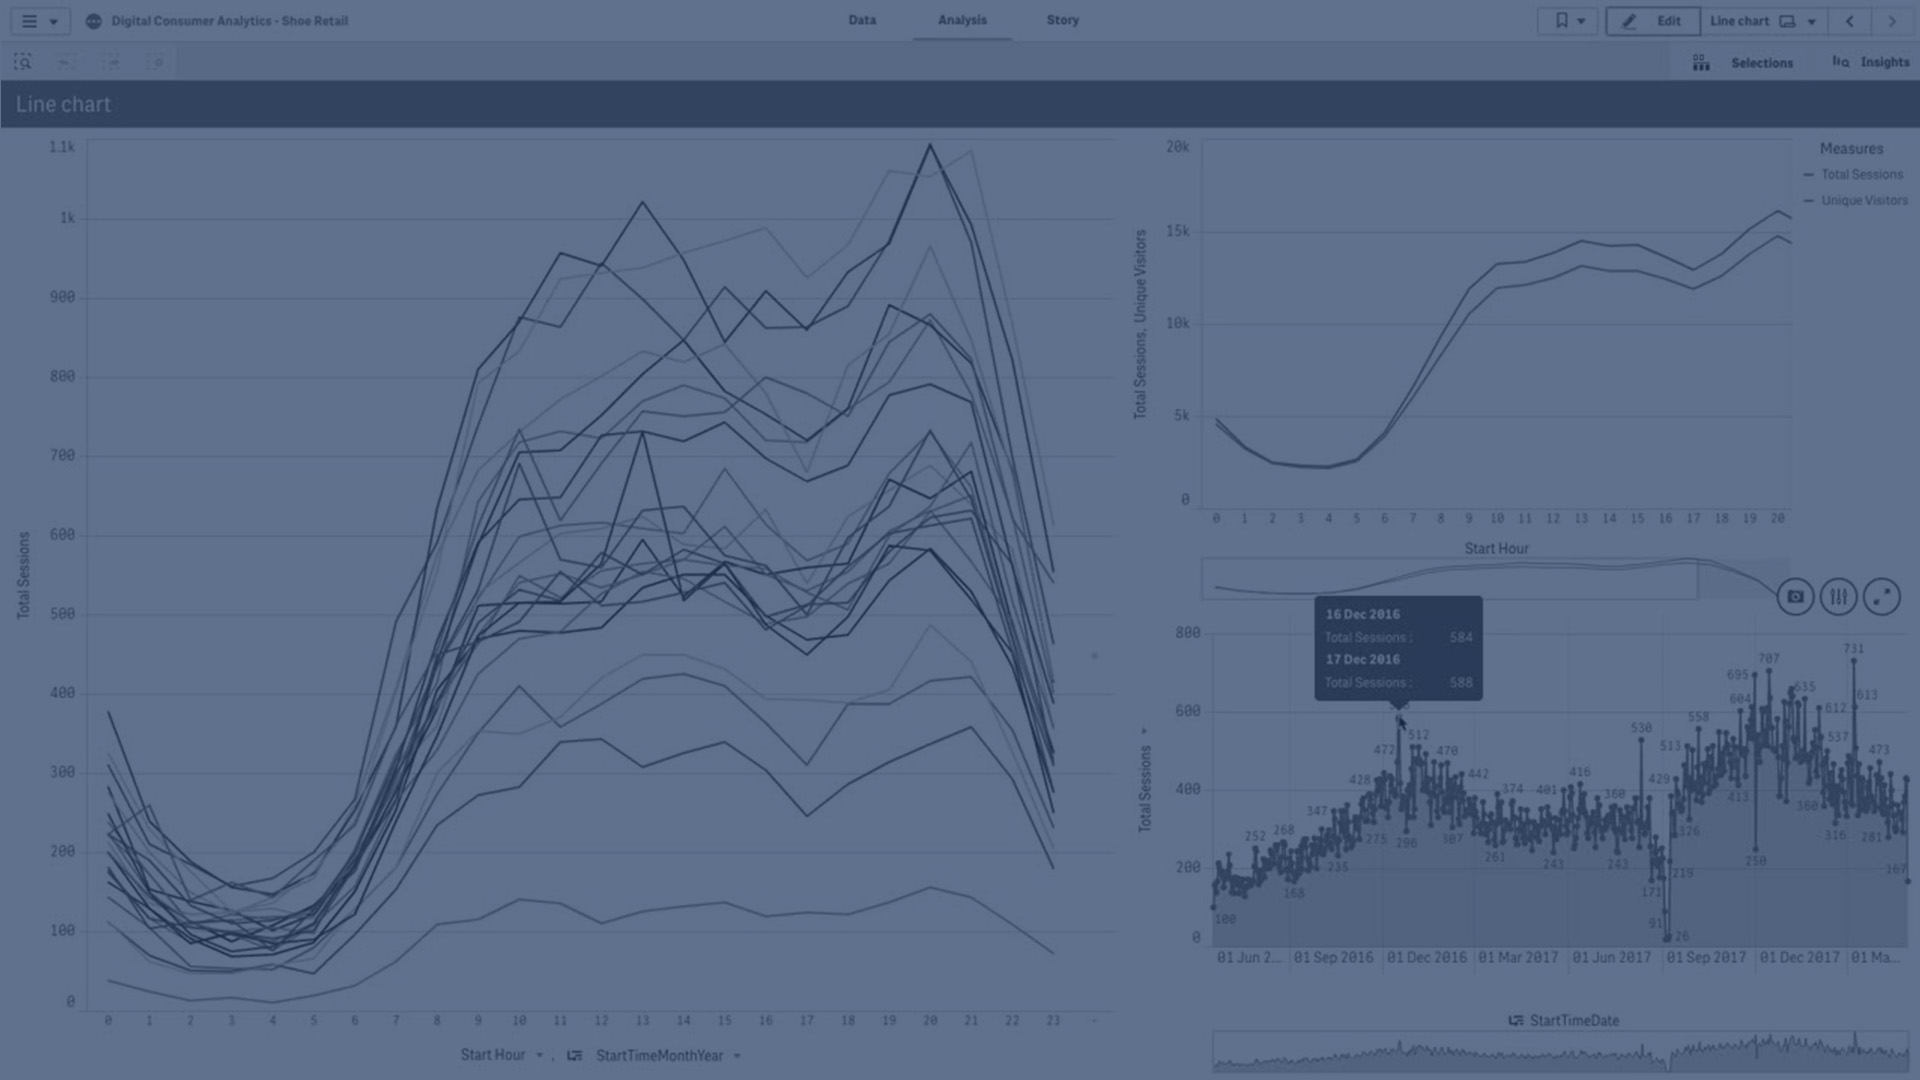
This video shows you how to create a line chart in Qlik Sense. Line charts are used to show trends over time. The line chart is primarily suitable when you want to visualize trends and movements over time, where the dimension values are evenly spaced, such as months, quarters, or fiscal years.