
Treemaps
Treemaps display hierarchical data by using nested rectangles, that is, smaller rectangles within a larger rectangle.
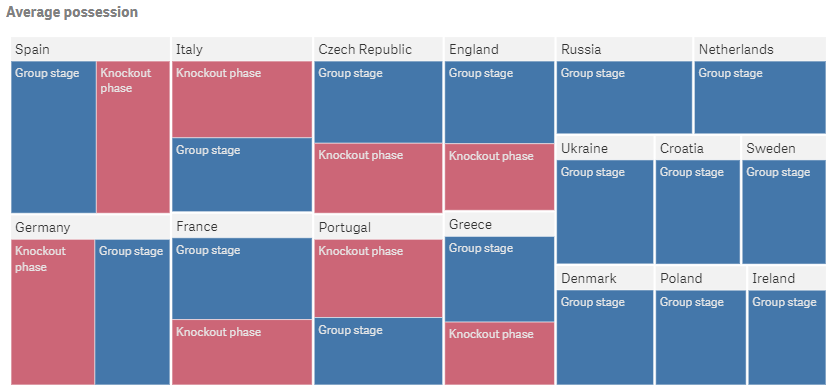
Sorting is automatic according to size. By default, the coloring is by dimension, with 12 colors, but that can be changed. When you have more than one dimension, you can decide which dimension to color by.
If the data set contains negative values, a text message is shown stating that the negative values cannot be displayed.
Number of columns (dimensions and measures)
In a treemap you need at least one dimension and one measure, but to make full use of the treemap it is preferable to have two or three dimensions. You can only have one measure, but up to 15 dimensions. However, using more than three dimensions is not recommended because the treemap may become unmanageable.
Columns (dimensions and measures)
Default settings for a treemap
Most native Qlik Sense chart types are automatically sorted on the dimension content:
- Numeric content is numerically sorted.
- Categorical content is alphabetically sorted.
Display limitations
When displaying large amounts of data in a treemap, there may be cases when not each dimension value within a rectangle is displayed with correct color and size. These remaining values will instead be displayed as a gray, striped area. The size and total value of the rectangle will still be correct, but not all dimension values in the rectangle will be explicit.
To remove the gray areas, you can either make a selection or use dimension limits in the properties.