The Quick Chart feature has been developed for users who want to create a simple chart in a quick and easy way, without bothering about the great number of different settings and options available.
The Quick Chart Wizard takes you through the following basic steps:
- Select chart type
- Define chart dimension(s)
- Define the chart expression
- Format chart
Depending on selections, some of the above steps may be skipped.
Starting the Quick Chart Wizard
Start the Quick Chart Wizard either by choosing Quick Chart Wizard from the Tools menu or by clicking on the corresponding button in the Design toolbar.
The first time the wizard is started a start page will open outlining the purpose of the wizard and the basic steps involved. If this start page should be skipped when the wizard is used in the future, mark the Don't show this page again check box. Click Next to continue. The Quick Chart Wizard goes through the following basic steps:
Step 1: Select chart type
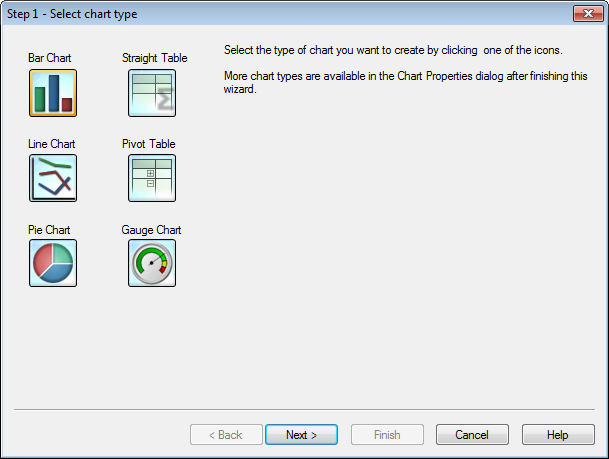
Select the type of chart you want to create by clicking on one of the icons. The chart types available are those most commonly used in QlikView. It is possible to change the chart into any other QlikView chart type via the Chart Properties dialog after finishing the wizard. Click Next to continue.
Step 2: Define dimension(s)
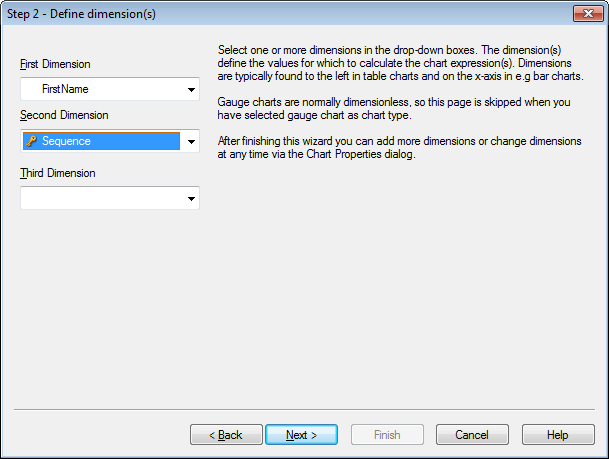
Unless you selected Gauge chart
in the first step, you will now see the Define Dimension page.
This page is automatically skipped for gauge charts because they do not
normally have any dimensions.
Select one or more dimensions
in the drop-down boxes. The dimension(s) define the values for which to
calculate the chart expression(s). Dimensions are typically found to the
left in the table charts and on the x-axis in e.g. bar charts.
After finishing this wizard you
can add more dimensions or change dimensions at any time via the Chart
Properties dialog.
Click Next to continue.
Step 3: Define Expression
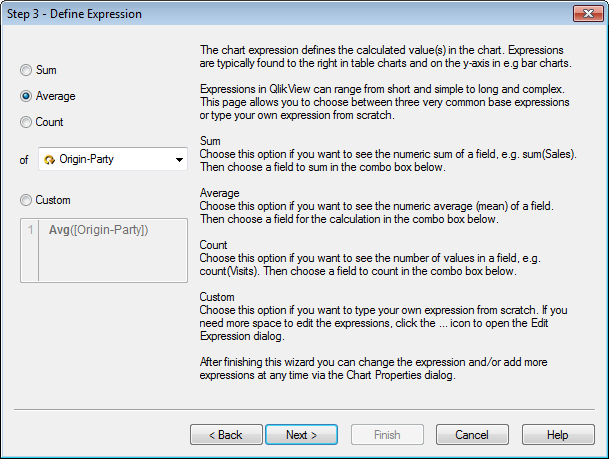
The chart expression defines
the calculated value(s) in the chart. Expressions are typically found
to the right in table charts and on the y-axis in e.g. bar charts.
Expressions in QlikView
can range from short and simple to long and complex. This page allows
you to choose between three very common base expressions or type your
own expression from scratch.
- Sum: Choose this option if you want to see the numeric sum of a field, e.g. sum(Sales). Then choose a field to sum in the combo box below.
- Average: Choose this option if you want to see the numeric average (mean) of a field, e.g. avg(Score). Then choose a field for the calculation in the combo box below.
- Count: Choose this option if you want to see the number of values in a field, e.g. count(OrderID). Then choose a field to count in the combo box below.
- Custom: Choose this option if you want to type your own expression from scratch. If you need more space to edit the expressions, click on the ... icon to open the Edit Expression dialog.
After finishing this wizard you
can change the expression and/or add more expressions at any time via
the Chart Properties dialog.
Click Next to continue.
The fourth step in the wizard allows you to adjust the format of the chart. As format settings vary between chart types, the contents of the page will be different depending on which chart type you selected in step 1 of the wizard.
Step 4: Chart format (bar chart)
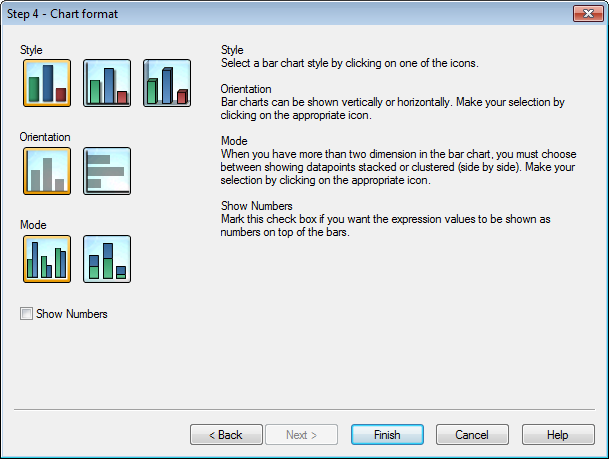
In this page you set formatting options for the selected chart type.
- Mode: When you have more than two dimensions in the bar chart, you must choose between showing data points stacked or clustered (side by side). Make your selection by clicking on the appropriate icon.
- Show Numbers: Mark this check box if you want the expression values to be shown as numbers on top of the bars.
Click Finish to finalize the chart and return to the layout. As mentioned before you can return to the chart at any time via the regular Chart Properties dialog to make further adjustments.
Step 4: Chart format (line chart)
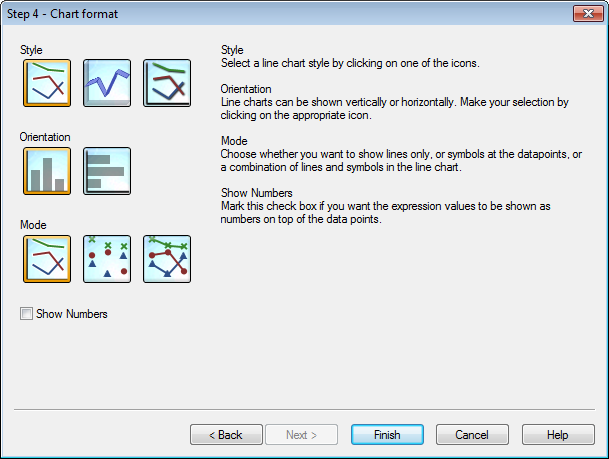
In this page you set formatting options for the selected chart type.
- Mode: Show data points as lines, symbols or a combination thereof. Make the selection by clicking on the appropriate icon.
- Show Numbers: Mark this check box if the expression values is to be shown as numbers on top of the data points.
Click Finish to finalize the chart and return to the layout. As mentioned before it is possible to return to the chart at any time via the regular Chart Properties dialog to make further adjustments.
Step 4: Chart format (pie chart)
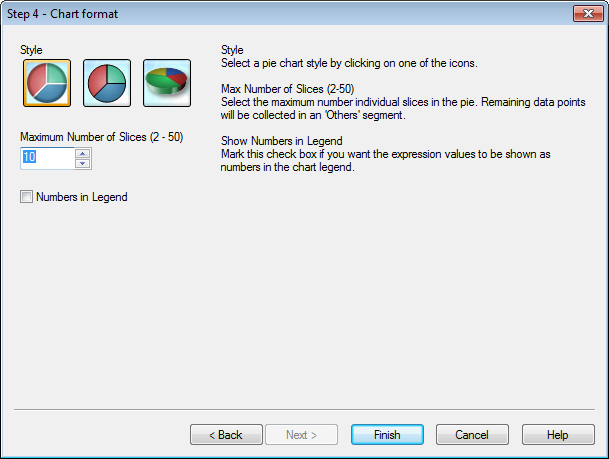
In this page you set formatting options for the selected chart type.
- Max Number of Slices (2-50): Select the maximum number of individual slices in the pie. Remaining data points will be collected in an 'Others' segment.
- Show Numbers in Legend: Mark this check box if you want the expression values to be shown as numbers in the chart legend.
Click Finish to finalize the chart and return to the layout. As mentioned before you can return to the chart at any time via the regular Chart Properties dialog to make further adjustments.
Step 4: Chart format (straight table)
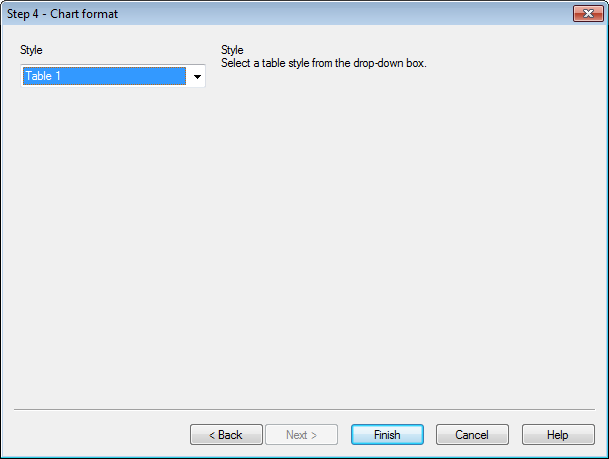
In this page you set formatting options for the selected chart type.
- Style: Select a table style from the drop-down box.
Click Finish to finalize the chart and return to the layout. As mentioned before you can return to the chart at any time via the regular Chart Properties dialog to make further adjustments.
Step 4: Chart format (pivot table)
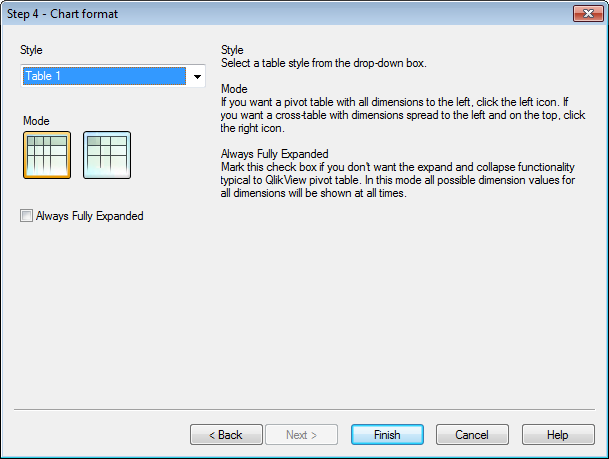
In this page you set formatting options for the selected chart type.
- Style: Select a table style from the drop-down box.
- Mode: If you want a pivot table with all dimensions to the left, click on the left icon. If you want a cross-table with dimensions spread to the left and on the top, click on the right icon.
- Always Fully Expanded: Mark this check box if you don't want the expand and collapse functionality typical to a QlikView pivot table. In this mode all possible dimension values for all dimensions will be shown at all times.
Click Finish to finalize the chart and return to the layout. As mentioned before you can return to the chart at any time via the regular Chart Properties dialog to make further adjustments.
Step 4: Chart format (gauge chart)
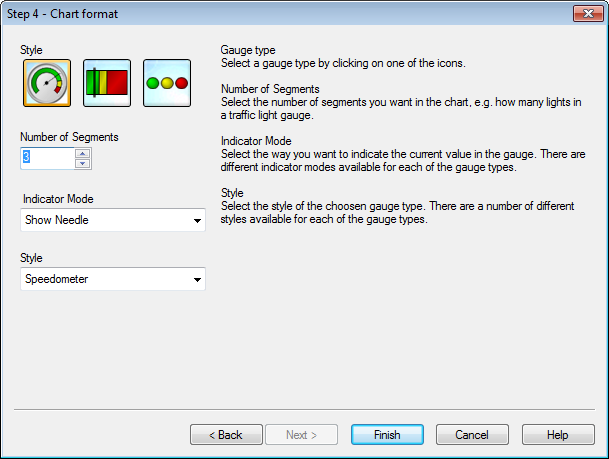
In this page you set formatting options for the selected chart type.
- Number of Segments: Select the number of segments you want in the chart, e.g. how many lights in a traffic light gauge.
- Indicator Mode: Select the way you want to indicate the current value in the gauge. There are different indicator modes available for each of the gauge types.
Click Finish to finalize the chart and return to the layout. As mentioned before you may return to the chart at any time via the regular Chart Properties dialog to make further adjustments.
