You can open a sheet from the app overview. In sheet view, you can do the following:
- Analyze with the app. You make selections in the visualizations and go into detail in your data to gain insights.
- Take snapshots of visualizations. You use the snapshots for building stories in data storytelling.
- Develop, or edit the app. You create sheets and visualizations to be used for data analysis. You cannot edit sheets of a published app, but if you have the correct permissions, you can create your own private sheets. You can also load another data file into the app.
The status of an app (published or not) affects what options are available in the menus and edit panel. For example, once the app has been published, you cannot:
- navigate to the data manager or the data load editor
- add data
- edit the app or open app options
Analyzing
You start analyzing data on a sheet by making selections in the visualizations. You can quickly see and move around among the sheets with the sheet navigator.

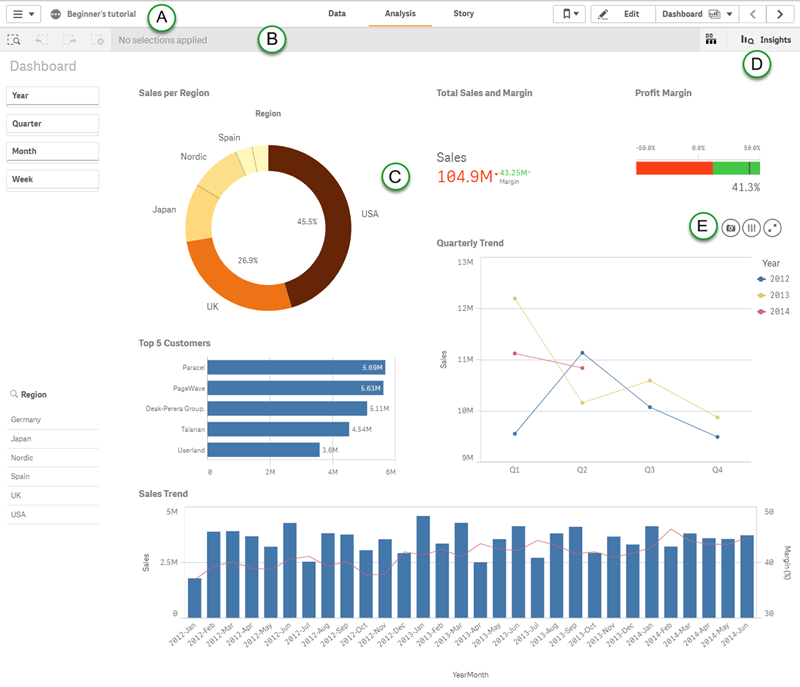
A: The toolbar
The toolbar contains the navigation menu, the global menu and other useful commands.
| UI item | Description |
|---|---|
|
|
Global menu with navigation options, and actions that you can perform in your app. For more information about tabbed browsing and the global menu, see Navigating using tabs. |
| Data |
Click the tab to perform data tasks. For example you can load data in the Data manager or the Data load editor, or view the data model in the Data model viewer. The Data tab is not available in a published app, unless you are the owner of the app. In that case, you can only open the Data model viewer. |
| Analysis |
Click the tab to perform analysis tasks. For example, you can create or interact with tables and charts. |
| Story |
Click the tab to build stories in your app. |
|
|
Show or hide app information, where you can choose to edit app information or open app options and style your app. |
|
|
Access to all stories in the app and to creating a new story. |
|
|
Access to all bookmarks in the app and to creating a new bookmark. |
|
|
Edit sheet. |
|
|
Access to all sheets in the app and to creating a new sheet using the sheet navigator. |
|
|
Previous sheet. |
|
|
Next sheet. |
See also:
- Managing data in the app with Data manager
- App overview
- Data load editor
- Data model viewer
- The hub
- Adding data to the app
- Exporting a sheet
- Publishing
- Storytelling view
- Collecting insights for stories using snapshots
- Bookmarking selections
- Navigating between sheets
B: Selections bar
The selections bar with tools for working with selections.
| UI item | Action |
|---|---|
|
|
Step back in selections. |
|
|
Step forward in selections. |
|
|
Clear all selections. |
|
|
Open smart search to search in the entire data set. For more information, see: Using smart search |
|
|
Open the selections tool, which is an extension of the selections bar. |
For more information, see Exploring with selections and Using the selections tool.
C: The sheet
The sheet with visualizations.
For more information about sheets, see Structuring an app using sheets.
D: Insight advisor
Access the insight advisor.
For more information, see Creating visualizations from your data using insight advisor.
E: Menu options
Hover menu with options.
Take snapshots
To take a snapshot of the visualization.
For more information, see Collecting insights for stories using snapshots.
Exploration menu
To change visualization properties without making selections or editing the sheet.
For more information, see Visual exploration.
Full screen
To explore data on a detailed level you can expand and work with one visualization at a time on the sheet.
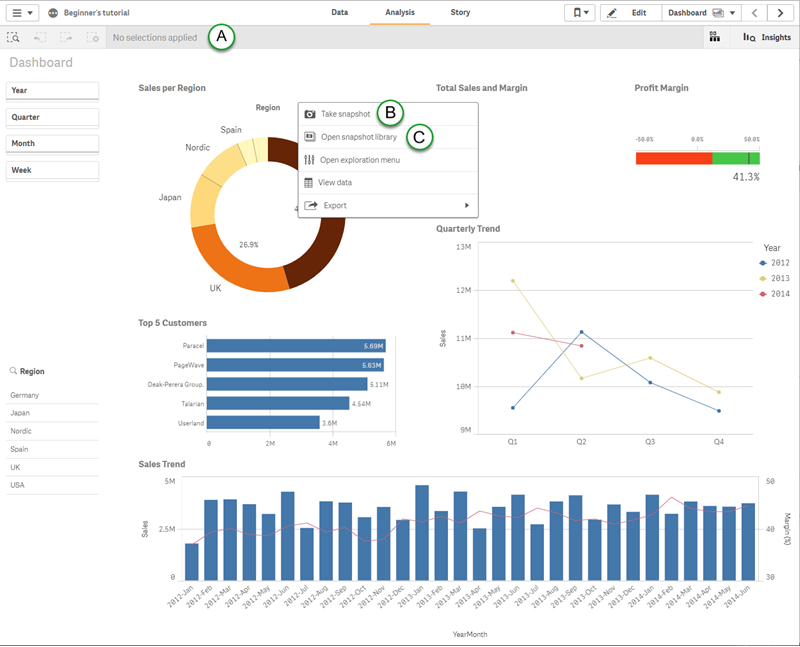
Taking snapshots
When you are in sheet view, you can take snapshots of the visualizations and use them to build a story in data storytelling.
You can take snapshots of all the different visualization types but not the filter panes.

A: Snapshot
Use to take a snapshot.
For more information, see: Collecting insights for stories using snapshots
B: Shortcut
Use in the shortcut menu to take a snapshot.
For more information, see Collecting insights for stories using snapshots.
C: Snapshot library
Use to open the snapshot library for this visualization.
For more information, see Snapshot library.
Develop (edit)
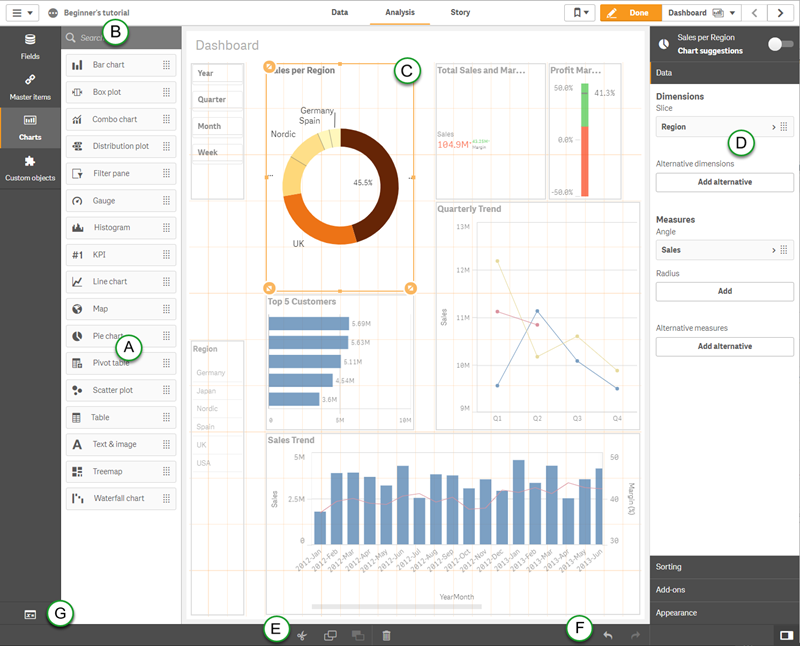
You enable editing of the sheet and its visualizations by clicking Edit in the toolbar. The properties panel opens on the right.
In an unpublished app, the left-hand panel contains assets such as measures, dimensions, fields and charts. You can create measures and dimensions from the assets panel, to use when building visualizations.
In a published app, the left-hand panel contains pre-made and ready-to-use master items (measures, dimensions and visualizations) and charts. You cannot update the existing sheets of a published app, but you can create new sheets to further develop the app.

A: Assets panel
In the assets panel of an unpublished app you find fields to use when creating dimensions and measures, and charts to use when creating visualizations. You can also use custom objects to create visualizations. You can save dimensions, measures and visualizations as master items for reuse.
In a published app, you find pre-made and ready-to-use master items (measures, dimensions and visualizations) .You also find charts and custom objects to use when creating your own visualizations.
For more information, see Assets panel.
B: Search
Use Search in the assets panel to search all items.
For more information, see Searching in the assets.
C: Selected
A selected visualization with resizing handles.
For more information, see Searching in the assets.
D: Properties
Properties of the selected visualization or the sheet. The properties for the sheet is shown if you have not selected a visualization.
For more information, see Creating and editing visualizations.
E: Edit items
Cut, copy, paste, and delete.
F: Undo and redo
Undo and redo your actions.
For more information, see Undoing and redoing actions.
G: Overview
Open the variables overview.
For more information, see Using variables in expressions.
Touch gestures in the sheet view
The table describes the touch gestures that are used in the sheet view.
| Touch gesture | Action |
|---|---|
| Long-touch and release | Open the shortcut menu |
| Long-touch a visualization | Open the options menu |
| Swipe | Scroll lists and visualizations |
| Pinch | Zoom in or out on visualizations |
| Two-finger tap | Select an interval in a list, table or bar chart axis |
| Two-finger swipe | Pan a scatter plot visualization |
| Three-finger tap | Reset the zoom level of a scatter plot visualization |
