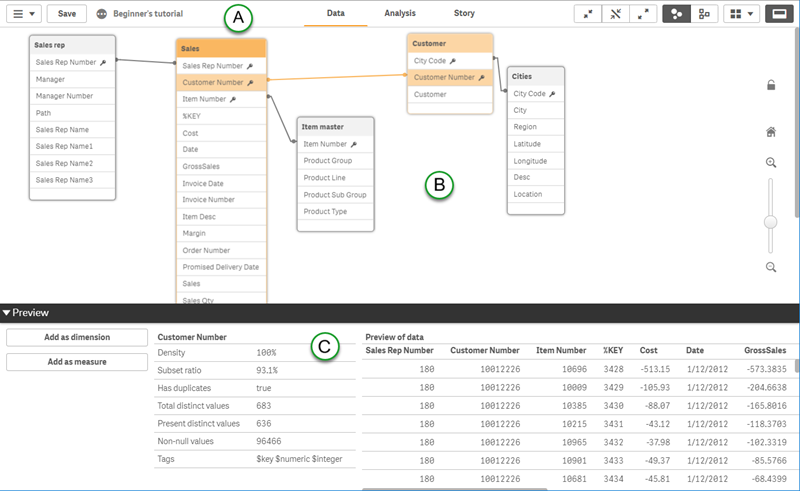
The data model viewer provides you with an overview of the data structure of an app. You can view detailed metadata about the tables and fields. You can also create dimensions and measures from the data fields.

A: The toolbar
The toolbar contains the navigation menu, the global menu and other useful commands.
| UI item | Description |
|---|---|
|
|
Global menu with navigation options, and actions that you can perform in your app. For more information about tabbed browsing and the global menu, see Navigating using tabs. |
| Data |
Click the tab to perform data tasks. For example you can load data in the Data manager or the Data load editor, or view the data model in the Data model viewer. The Data tab is not available in a published app, unless you are the owner of the app. In that case, you can only open the Data model viewer. |
| Analysis |
Click the tab to perform analysis tasks. For example, you can create or interact with tables and charts. |
| Story |
Click the tab to build stories in your app. |
| Save | Save changes. |
|
|
Show or hide app information, where you can choose to edit app information or open app options and style your app. |
|
|
Collapse all tables to show the table name only. |
|
|
Reduce the size of all tables to show the table name and all fields with associations to other tables. |
|
|
Expand all tables to show all fields. |
|
|
Internal table view - the Qlik Sense data model including synthetic fields. |
|
|
Source table view - the data model of the source data tables. |
|
|
Layout menu with the options Grid layout, Auto layout and Restore layout. |
|
|
Open and close the preview pane. |
B: Overview
An overview of all tables and fields in the app, and of the associations between them. You can change the zoom level by clicking Y, Z or using the slider. Click ü to restore the zoom level to 1:1.
You can lock the table layout (positions and sizes), by clicking . To unlock the table layout, click
.
For more information, see Viewing the data model.
C: Preview pane
The preview pane with details about the tables and fields.
For more information, see Preview of tables and fields in the data model viewer.
